Zoom In on ARB and the Rally Only Gets Steeper
 Coinyong
 ARB
ARB
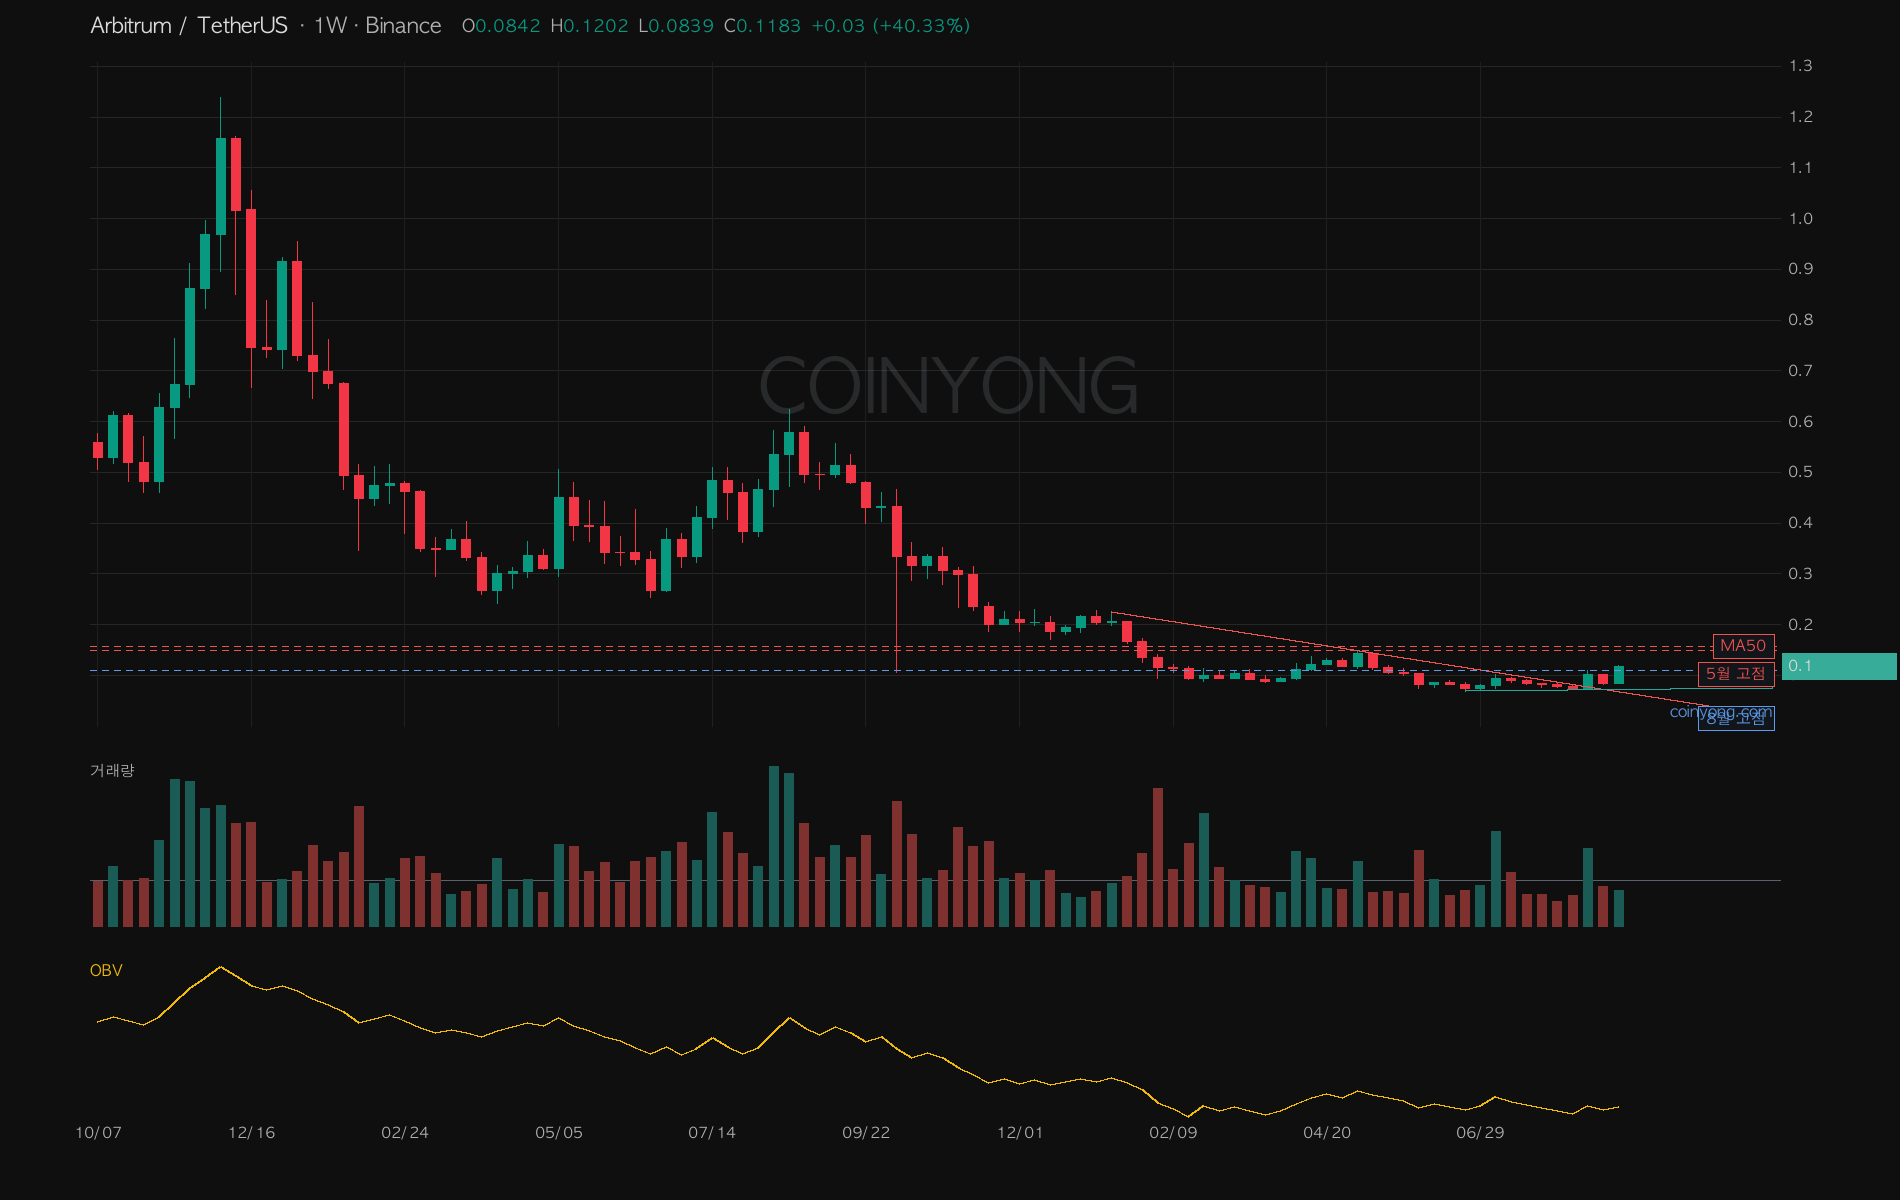
Tuesday morning, Arbitrum (ARB) jumped more than 40% over two days, making it the standout coin in today's market.
On the weekly, it cleared the line that had been pressing down since January in the third week of August, and this week's candle is sitting above the August high of 0.1096.
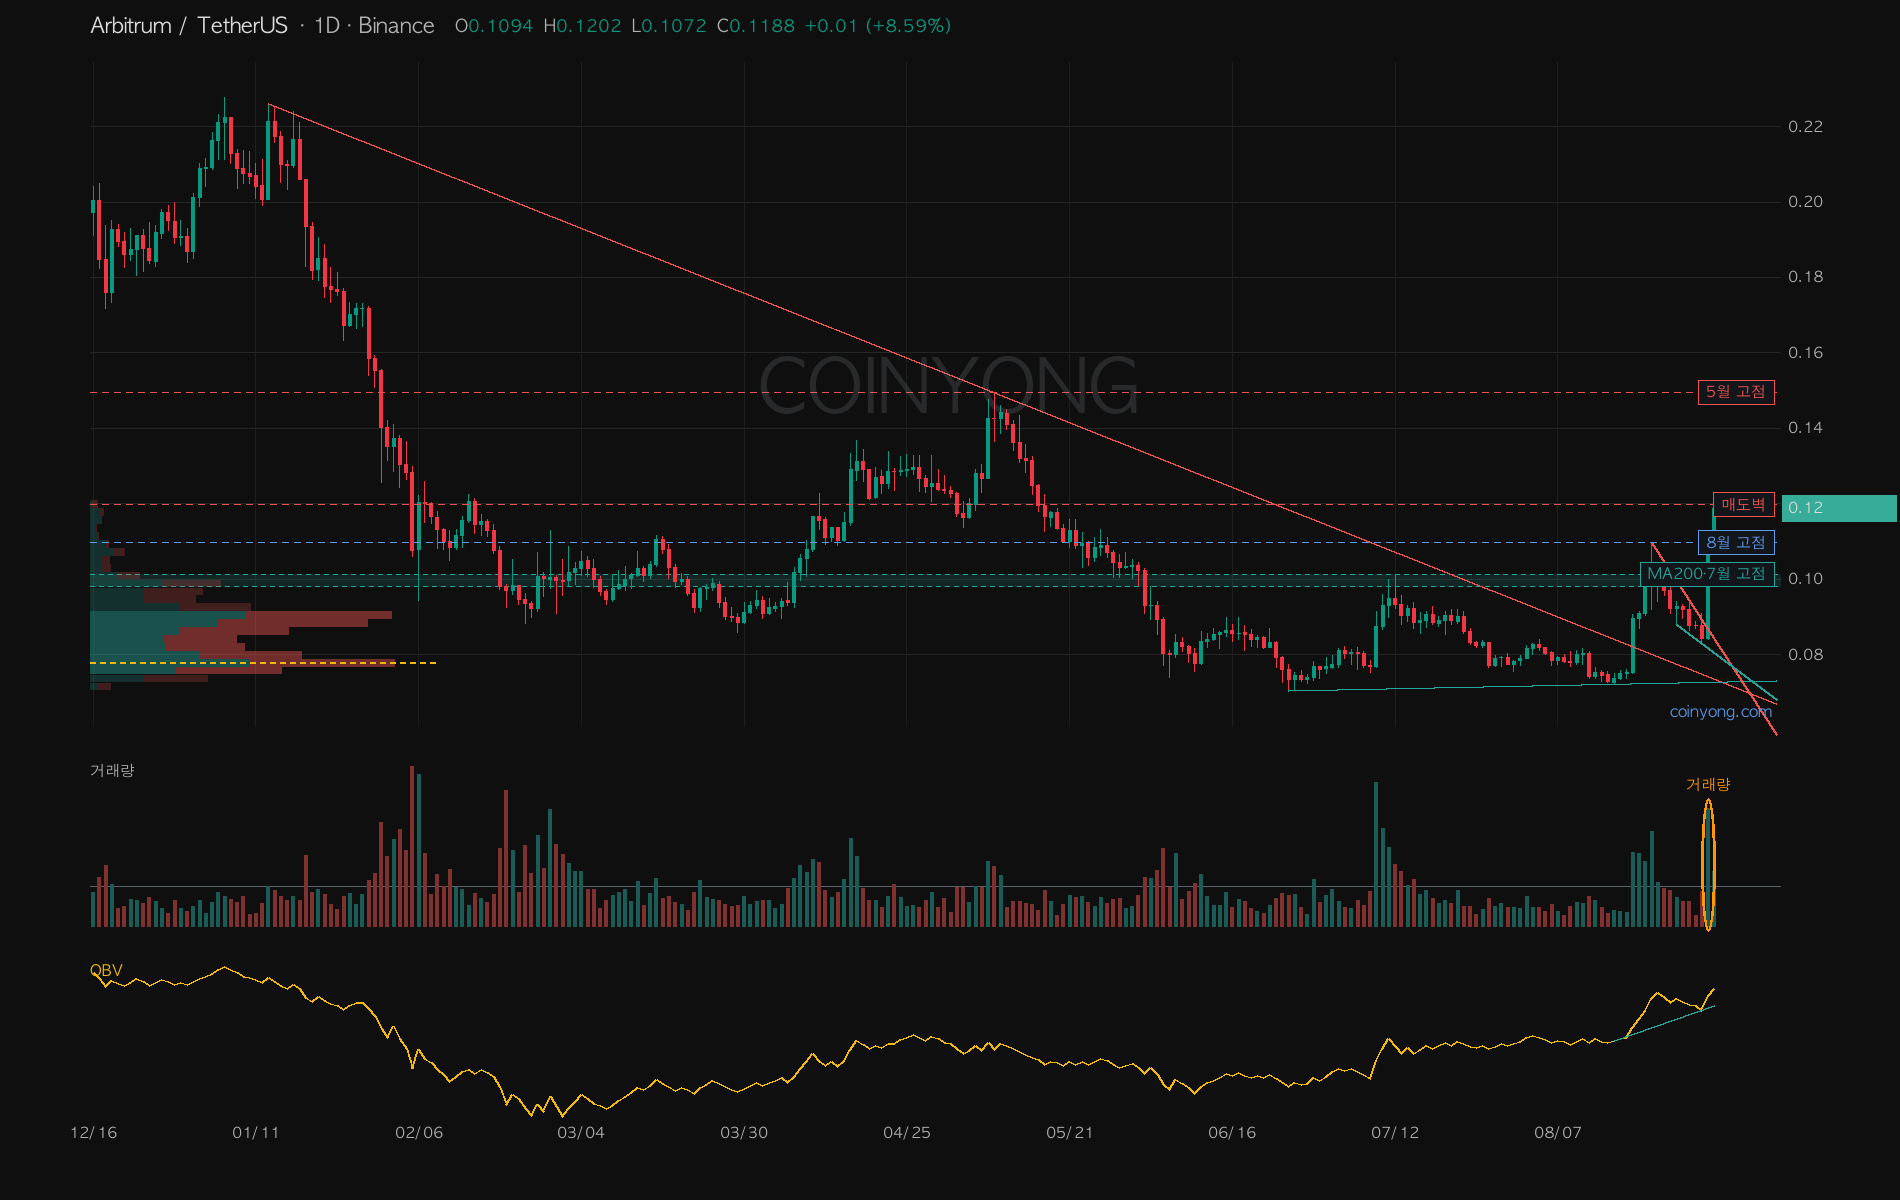
The daily closed yesterday at 0.1094, just shy of a close above 0.1096, but today it stretched higher again on a big pickup in volume.
On the weekly it looks like it's just lifting its head off the bottom, on the daily it has broken free of a long downtrend line, and on the 4-hour it went almost vertical — the lower the timeframe, the steeper the angle of the move.
That said, the center of the last 80 days' volume profile is 0.0782, so the current area is a thin-volume zone it crossed quickly, and a pullback could quickly open the way to 0.0981–0.1013.
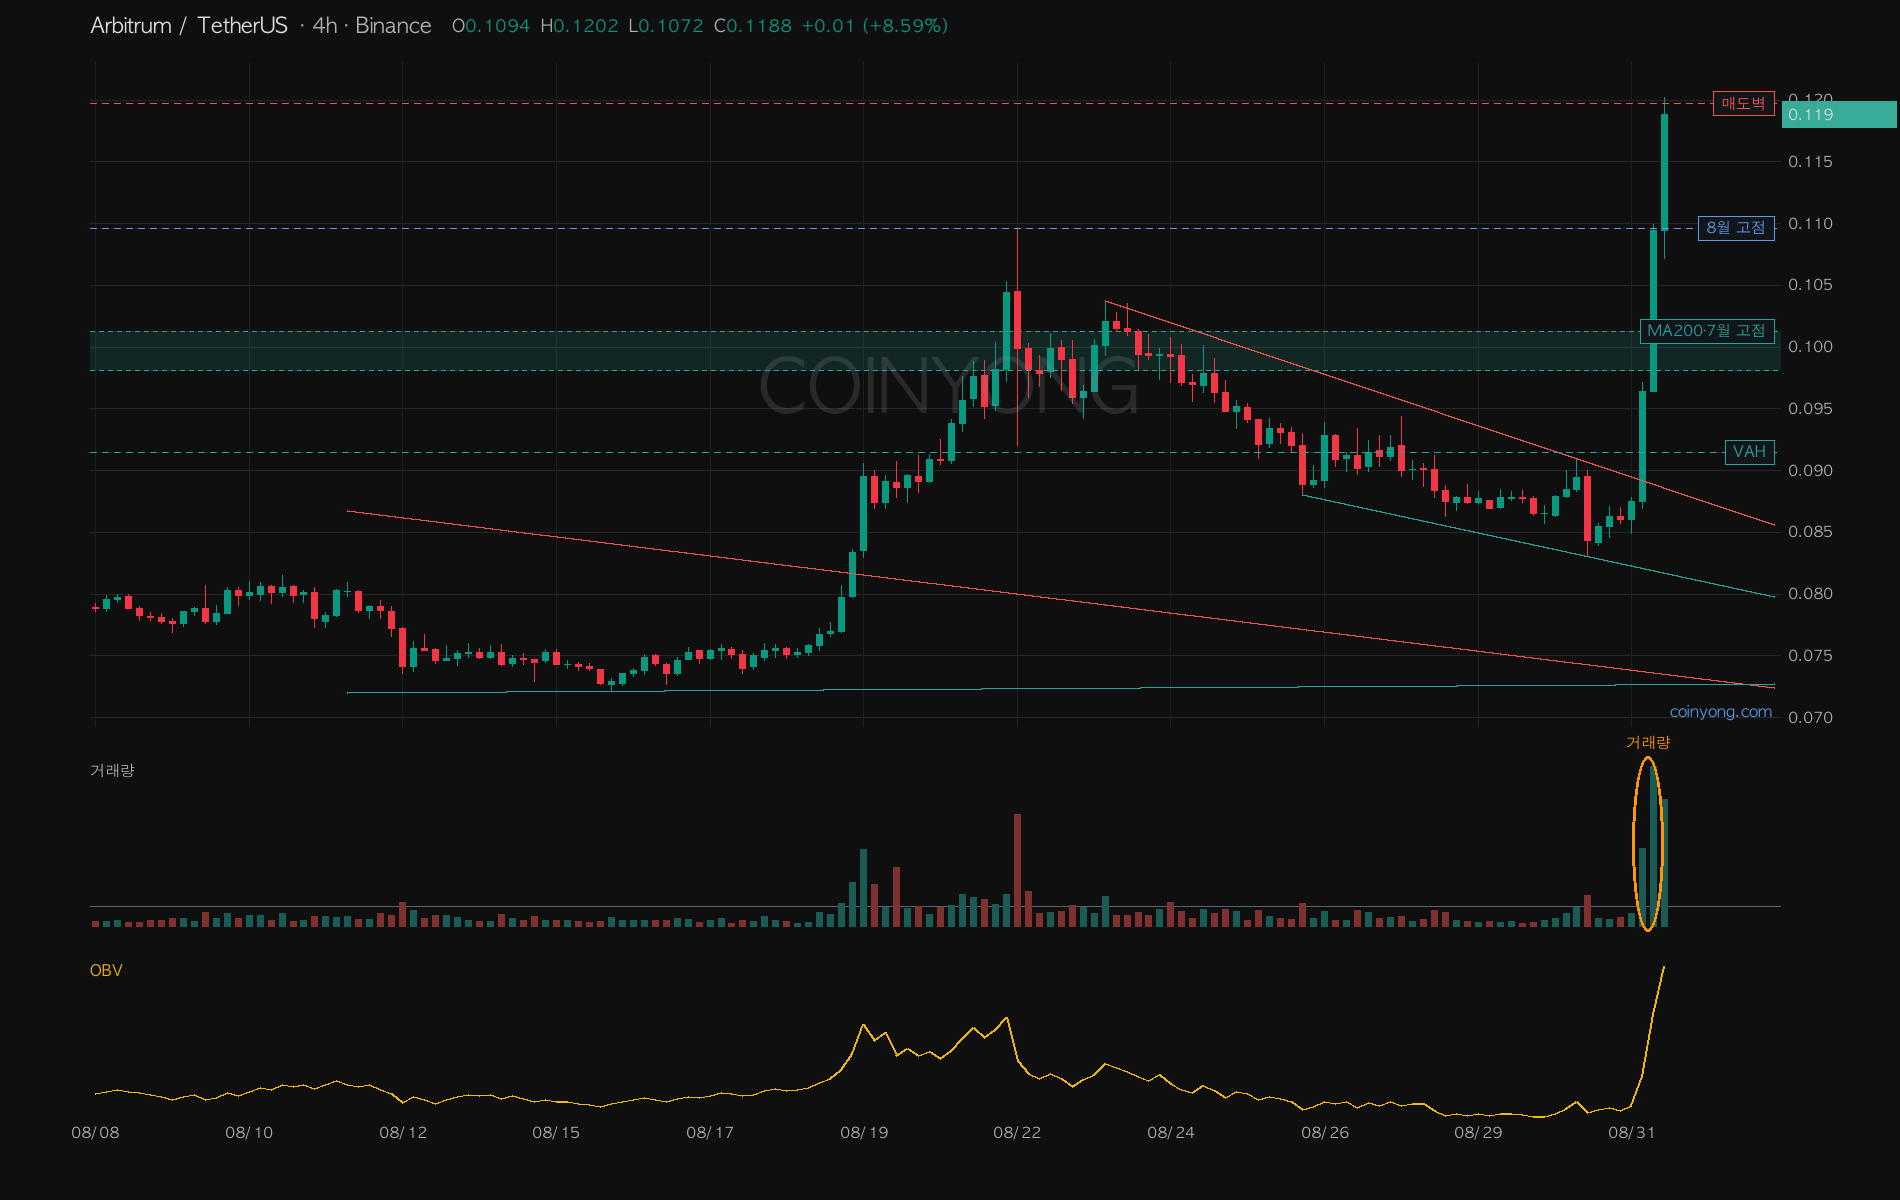
On the 4-hour, it broke out of a short descending channel on volume, cleared 0.1096 in one move, and is now knocking right on the 0.1197 ask wall.
Price and volume alone show clear strength, but CVD over the past 24 hours and large orders are still on the sell side, so follow-through buying hasn't fully kicked in yet.
A 4-hour close above 0.1197 favors the rally continuing, while losing 0.1096 again means leaving room for a quick cooldown toward 0.0981.
 ETH
ETH BTC
BTC LINK
LINK