BTC's First Knock at $80K — and the Pullback Looks Healthy
 Coinyong
 BTC
BTC
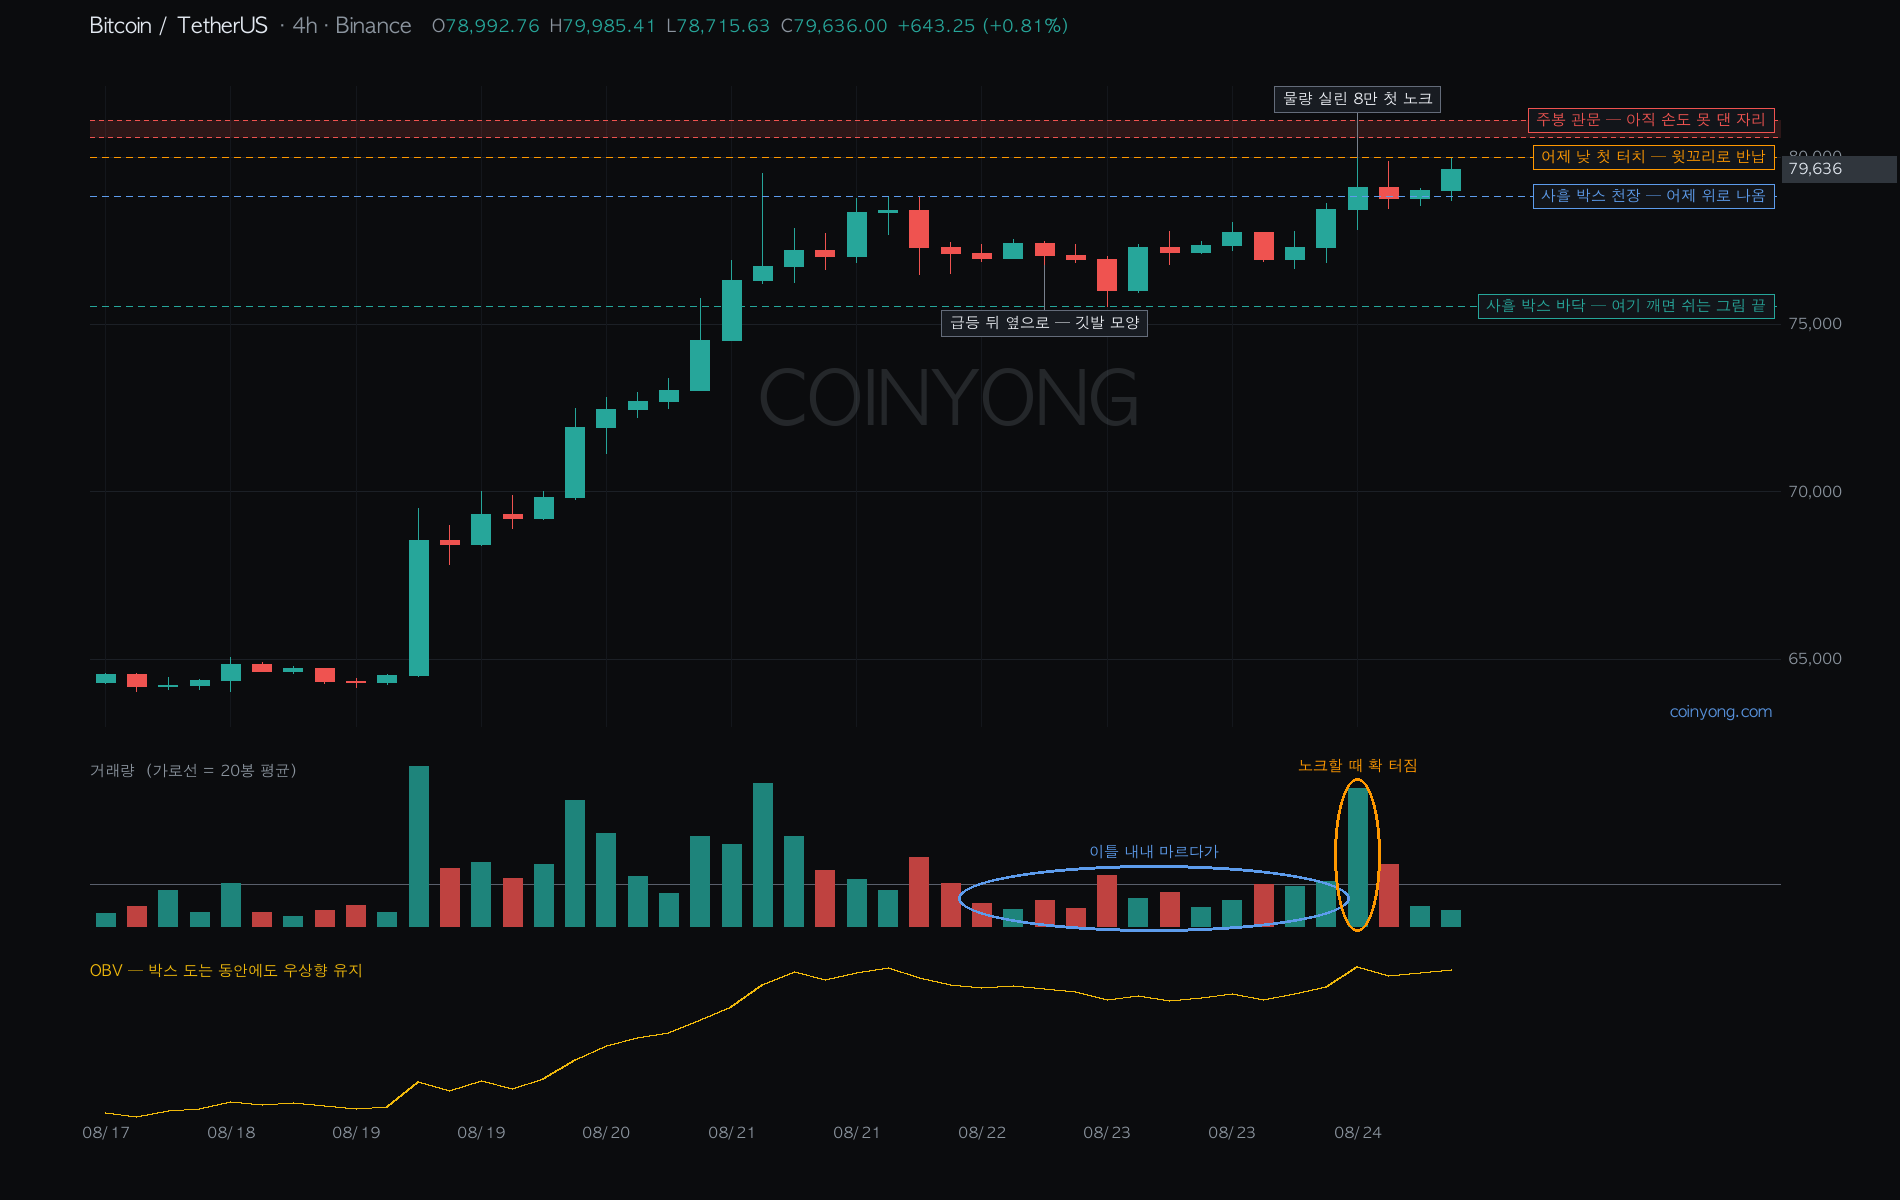
After breaking out of a two-month squeeze last week, Bitcoin knocked on $80K for the first time yesterday during the day. Today I'll focus on just this one knock, on the 4H chart. Volume had been dry for two straight days and suddenly exploded on that one candle — it tagged exactly 80000 and came back down with an upper wick. Getting pushed back on the first touch of resistance is common, so nothing surprising so far.
What I'm watching is the shape of the pullback. Normally, a hard rejection from above sends price straight to the bottom of the range, but this time it got bought right away around 78500 and was back up to 79800 within half a day. A shallow dip followed by an immediate retest reads as fewer sellers up top than you'd expect. OBV kept trending up the whole time it was ranging, too. Shape-wise, it's a flag — sideways drift after a sharp run-up — which by the textbook leans toward continuation.
The real gate is right above at 80600–81100. That's a weekly level, so even if 80K goes, there'll be another fight there. On the other hand, the stretch in between was covered in just the last four days, so there's very little supply built up. As long as the three-day range low near 75500 holds, this picture stays intact. There's a saying that resistance gets thinner the more it's tested, and this is a spot where I'd like to bet on that. I think all we need to watch is when the second knock comes.
 ETH
ETH LINK
LINK