ETH Is Charging, While BTC Just Waits and Watches
 Coinyong
 BTC
BTC
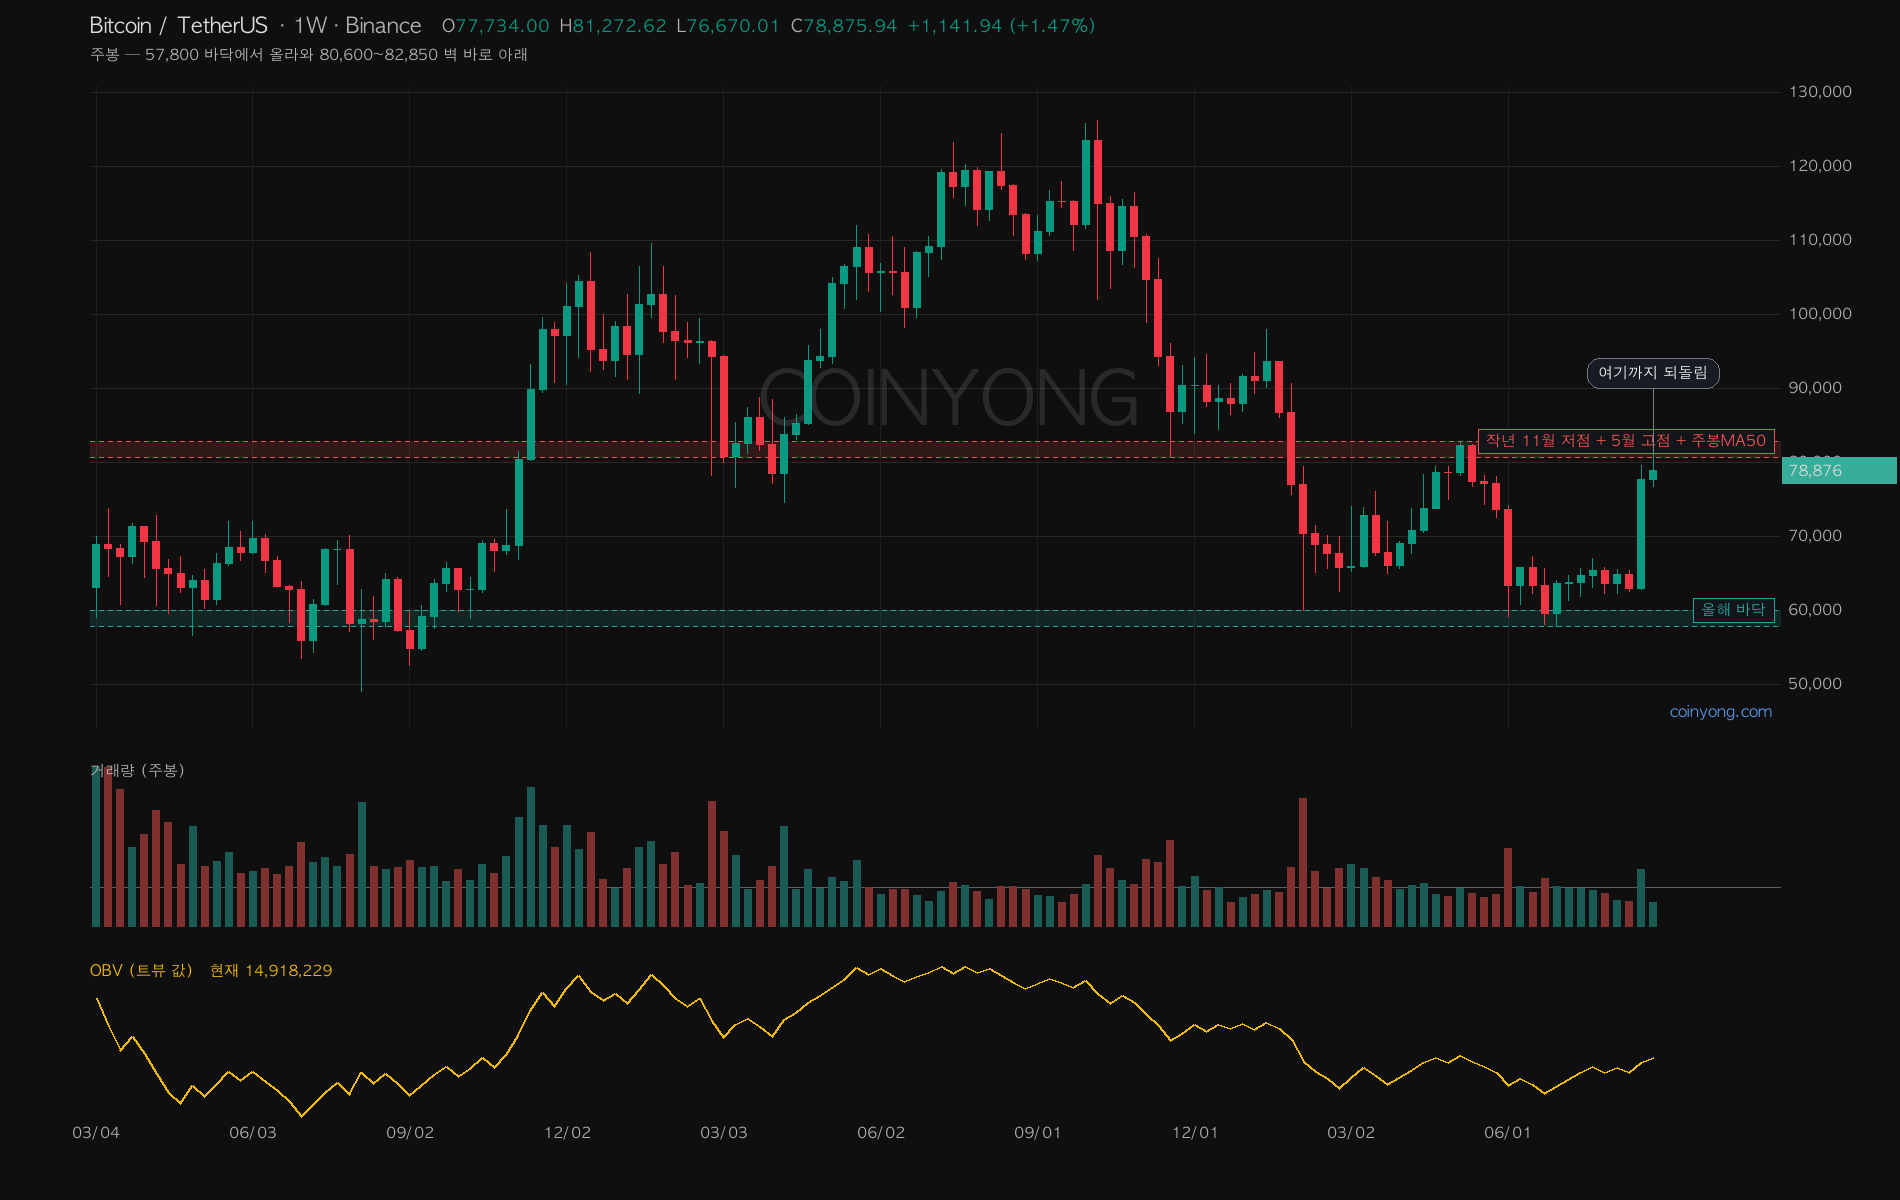
I looked at ETH first today, and large buyers were piling in aggressively. So I opened BTC expecting the same, but the mood here is surprisingly different. Both are standing in front of the wall overhead, yet the conviction behind them is night and day, so that's what I want to talk about today.
Starting with the big picture, BTC bottomed at 57,800 in early July and climbed to 79,000 in a month and a half. Overhead, 80,600 to 82,850 is where last November's low and May's high overlap and the weekly MA runs through — a wall it hasn't been able to clear for over two months. Getting this far is already a solid run.
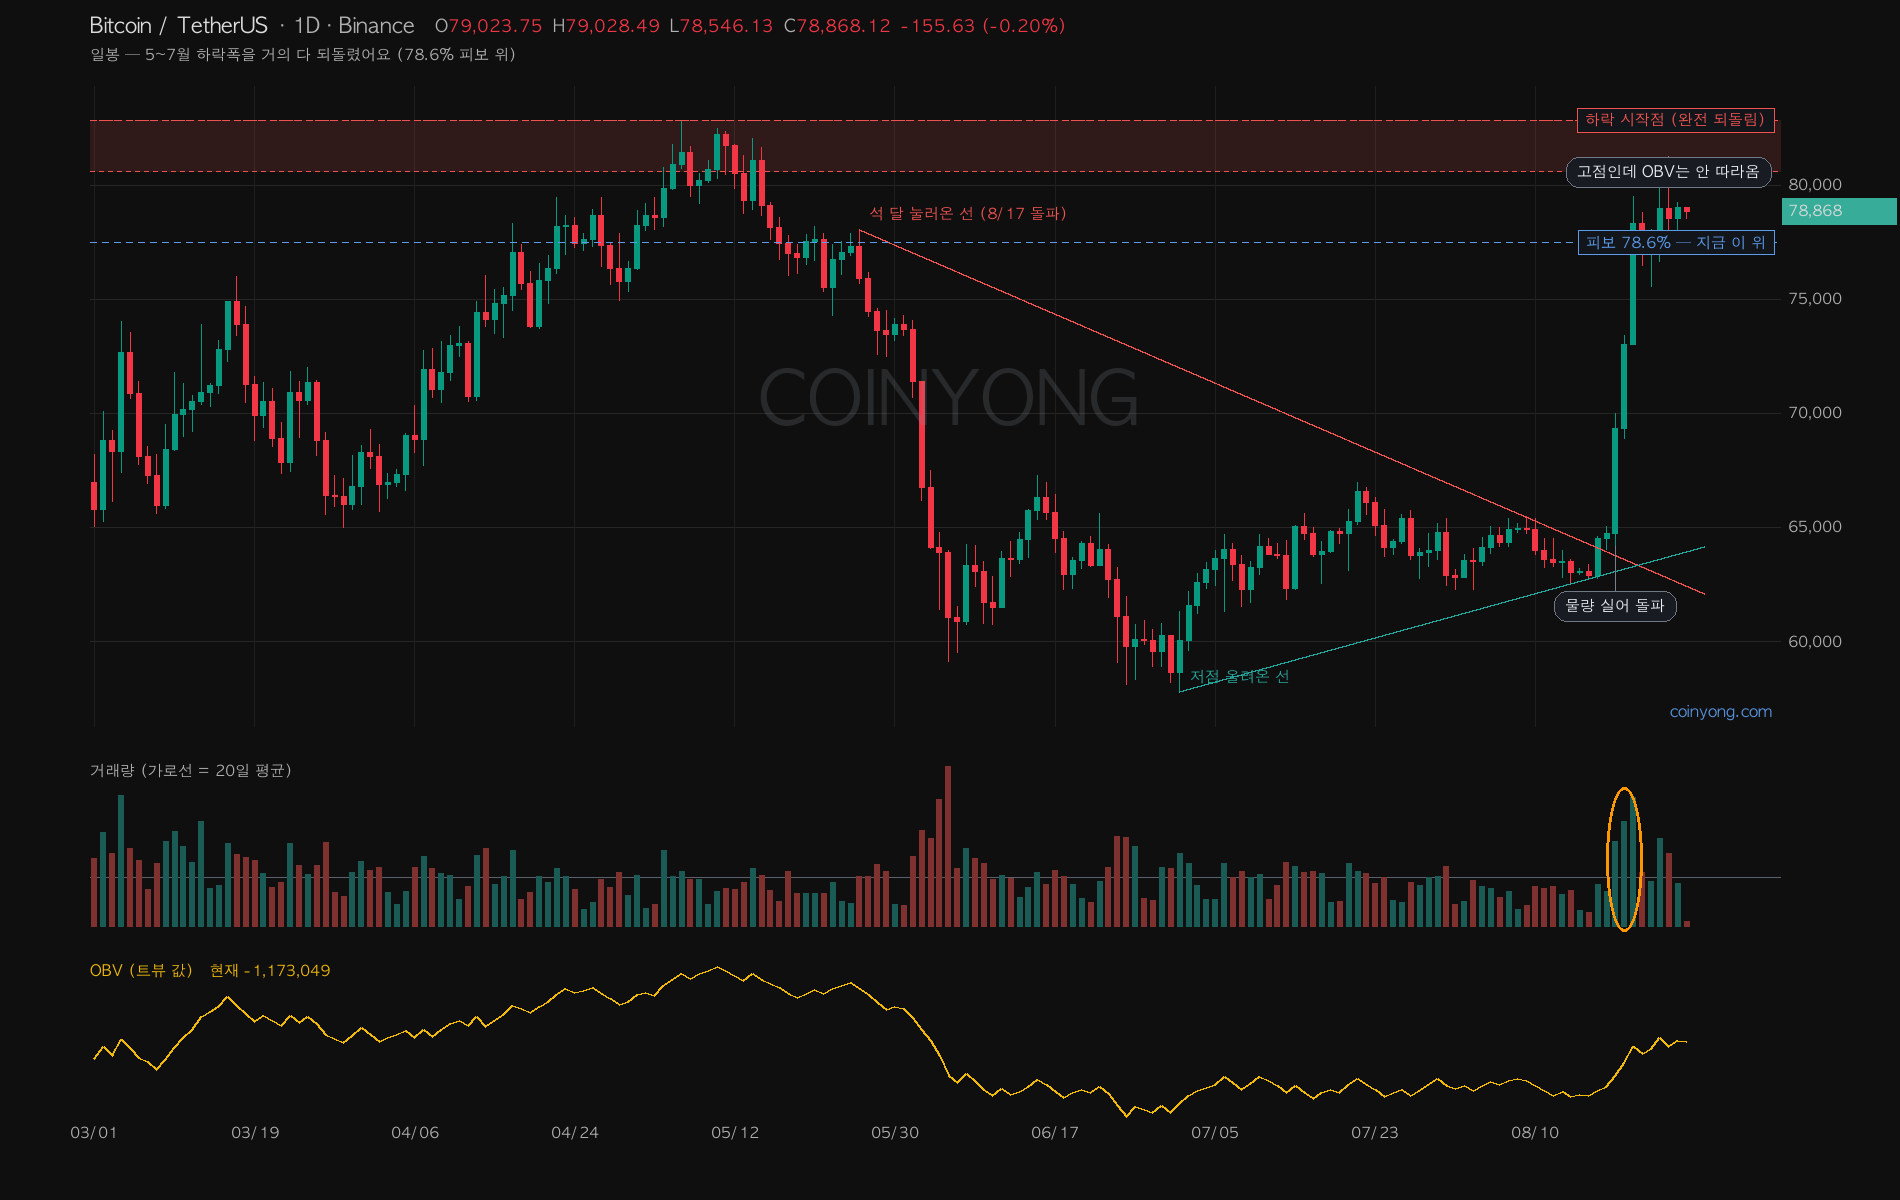
Drawing a Fib on the daily, price has already cleared the 78.6% retracement of the drop from 82,850 in May to 57,800 in July. In other words, it has recovered almost the entire decline — the problem is the final push. Look at OBV at the bottom of the chart: when price made a new high at 81,273 on August 25, OBV failed to clear its previous high. Price went up, but the volume driving it actually shrank. ETH, which I looked at earlier, has OBV rising in step with price, but on BTC it isn't following — that's the biggest difference today.
Executed flow tells the same story. It's true that large orders flipped to the buy side on BTC today as well. But the size was only about $30 million. Over the same window, ETH saw more than $100 million in large-order buying. Both turned in the same direction, but ETH charged in while BTC just dipped a toe. With RSI at 80, there's limited room on the upside as well.
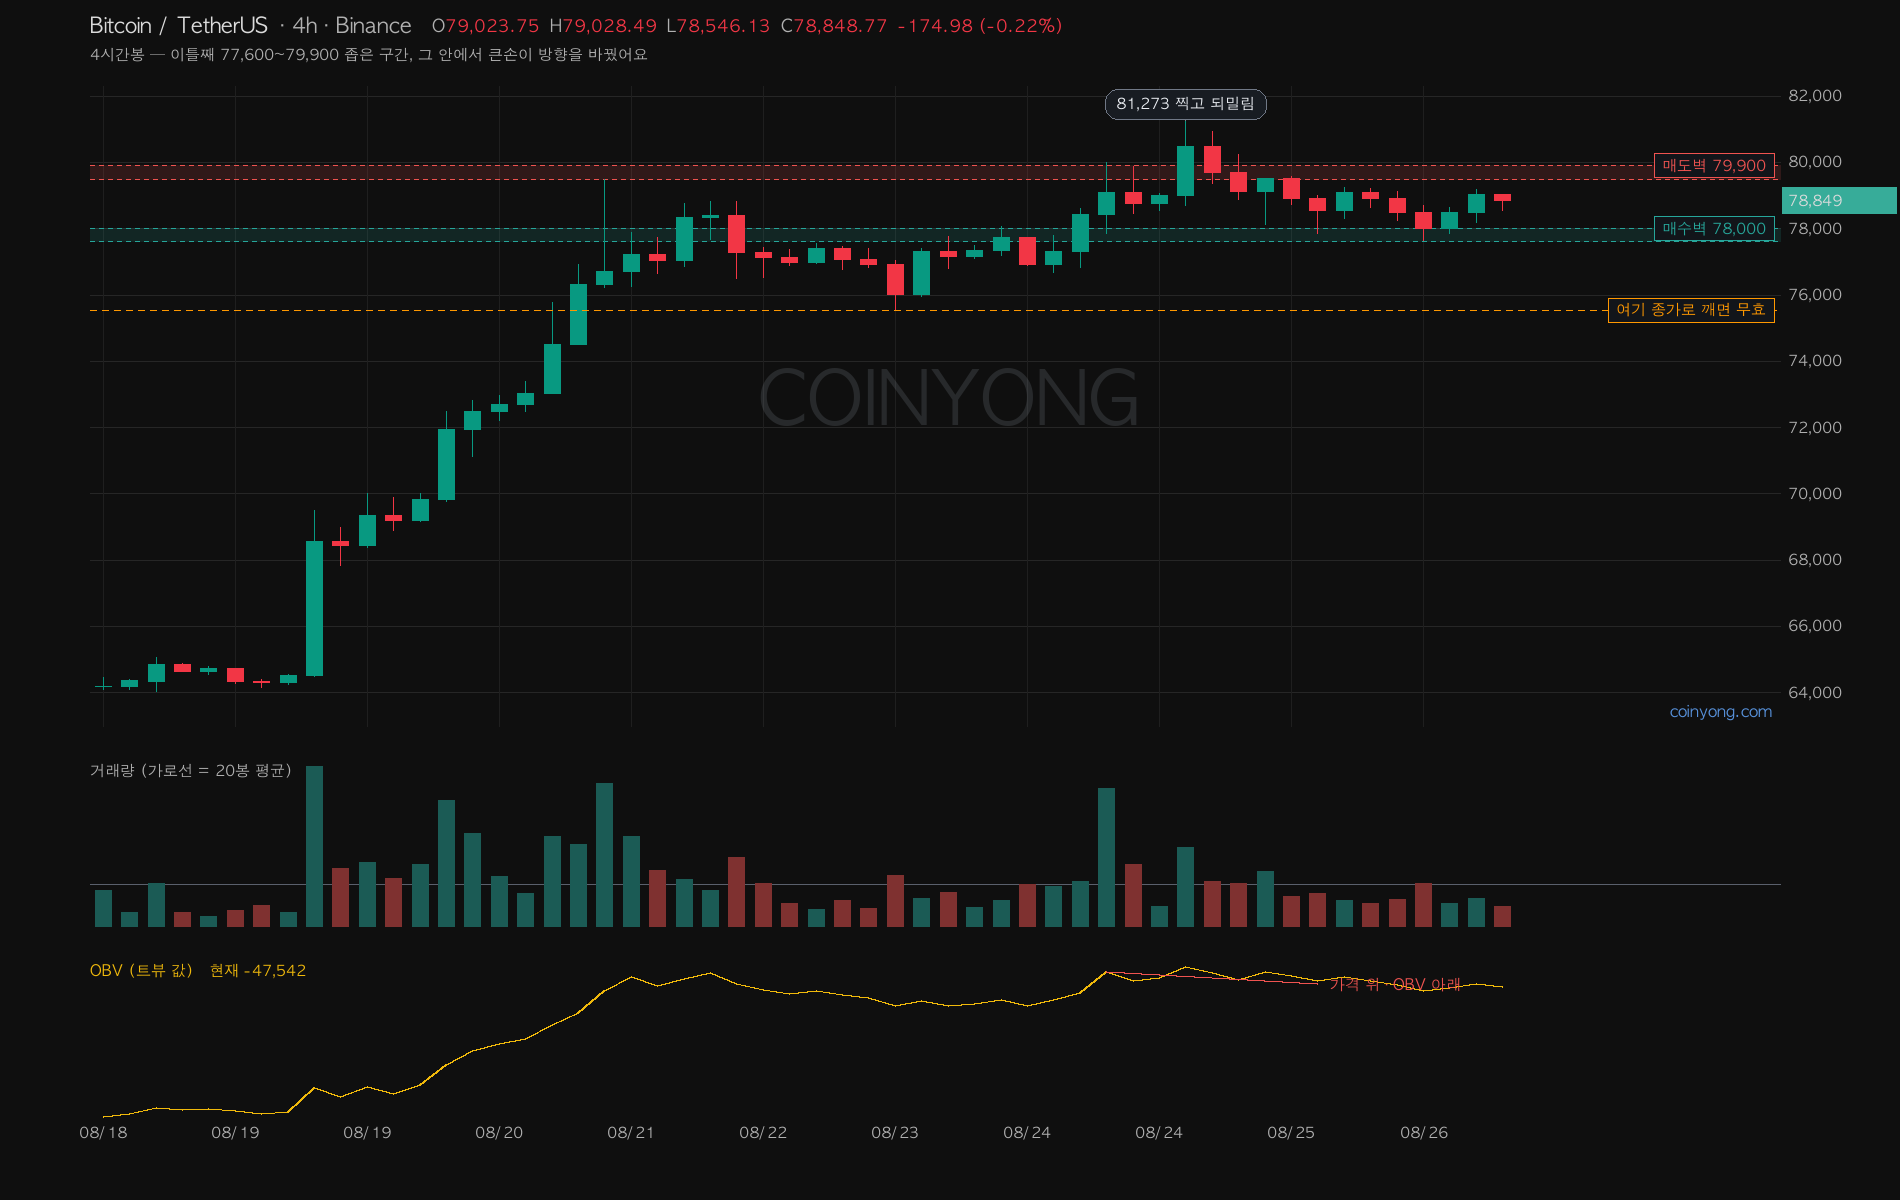
Zooming into the 4H, it's been stuck between 77,600 and 79,900 for two days. There's a thick sell wall at 79,900 above and support at 78,000 below, so it's boxed in right between them. Unlike ETH pressing hard into its wall, this looks like BTC hovering below the wall, waiting to see what happens.
So I don't think this is a spot where BTC breaks out on its own. To get over 79,900, I think ETH needs to clear its 2,560 wall first and lead the market. OBV isn't backing BTC and buying is lukewarm, so it doesn't have the strength to push through alone. Conversely, if ETH gets rejected at its wall, the one that slips first will likely be the weaker BTC. Giving up 78,000 on a close would be that signal, and a close below 75,546 is where I'd call this rally done. In the end, today BTC is in a spot where it waits to see how far ETH goes and rides along.
 ETH
ETH LINK
LINK