Fed Hikes, and Bitcoin Barely Flinches?
 Coinyong
 BTC
BTC
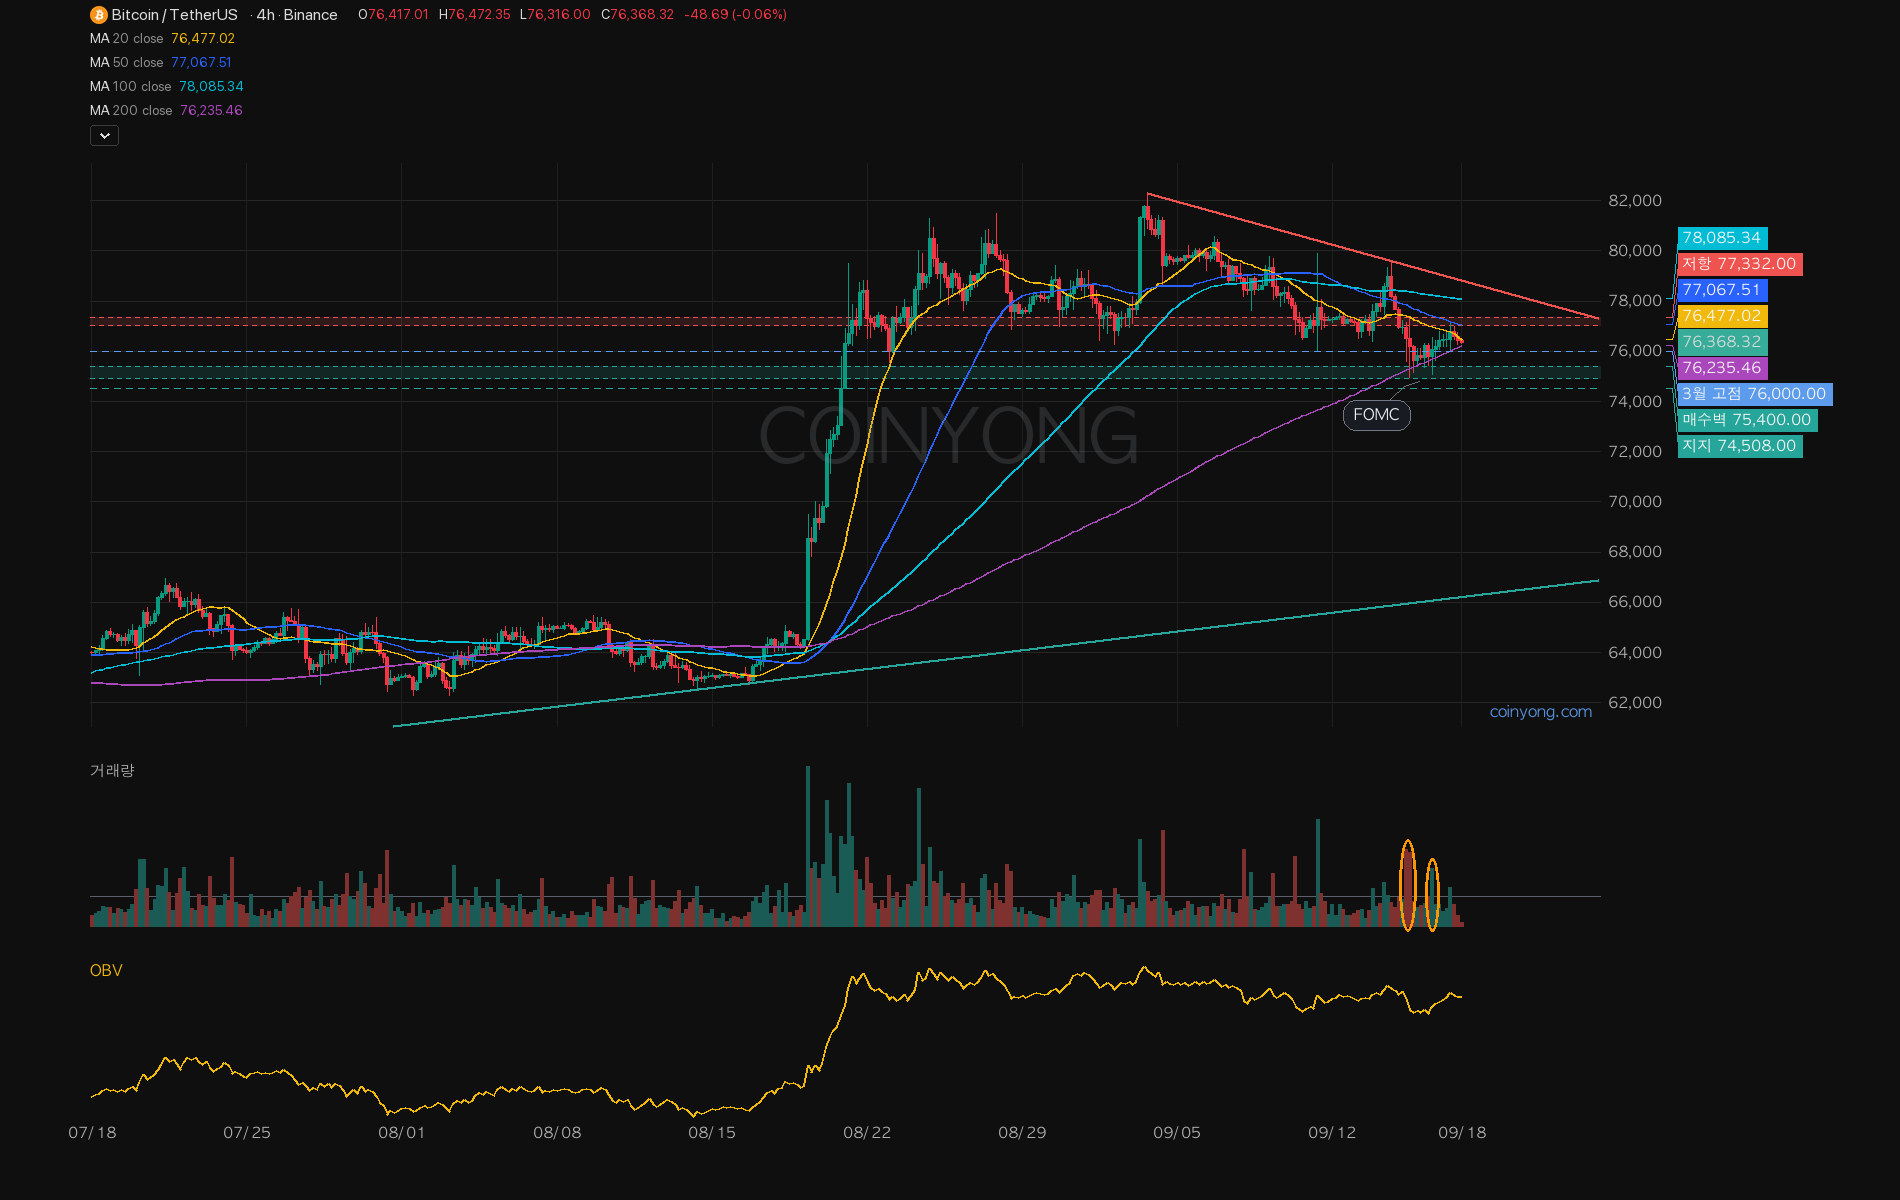
The Fed hiked by 25 basis points in the early hours yesterday, but Bitcoin (BTC) tagged 75064 and immediately climbed back above 76000. It didn't reach the 74500 I mentioned in my last post; the bounce came just above it. Since the hike was expected, volume was lighter than I thought and it didn't drop much either~
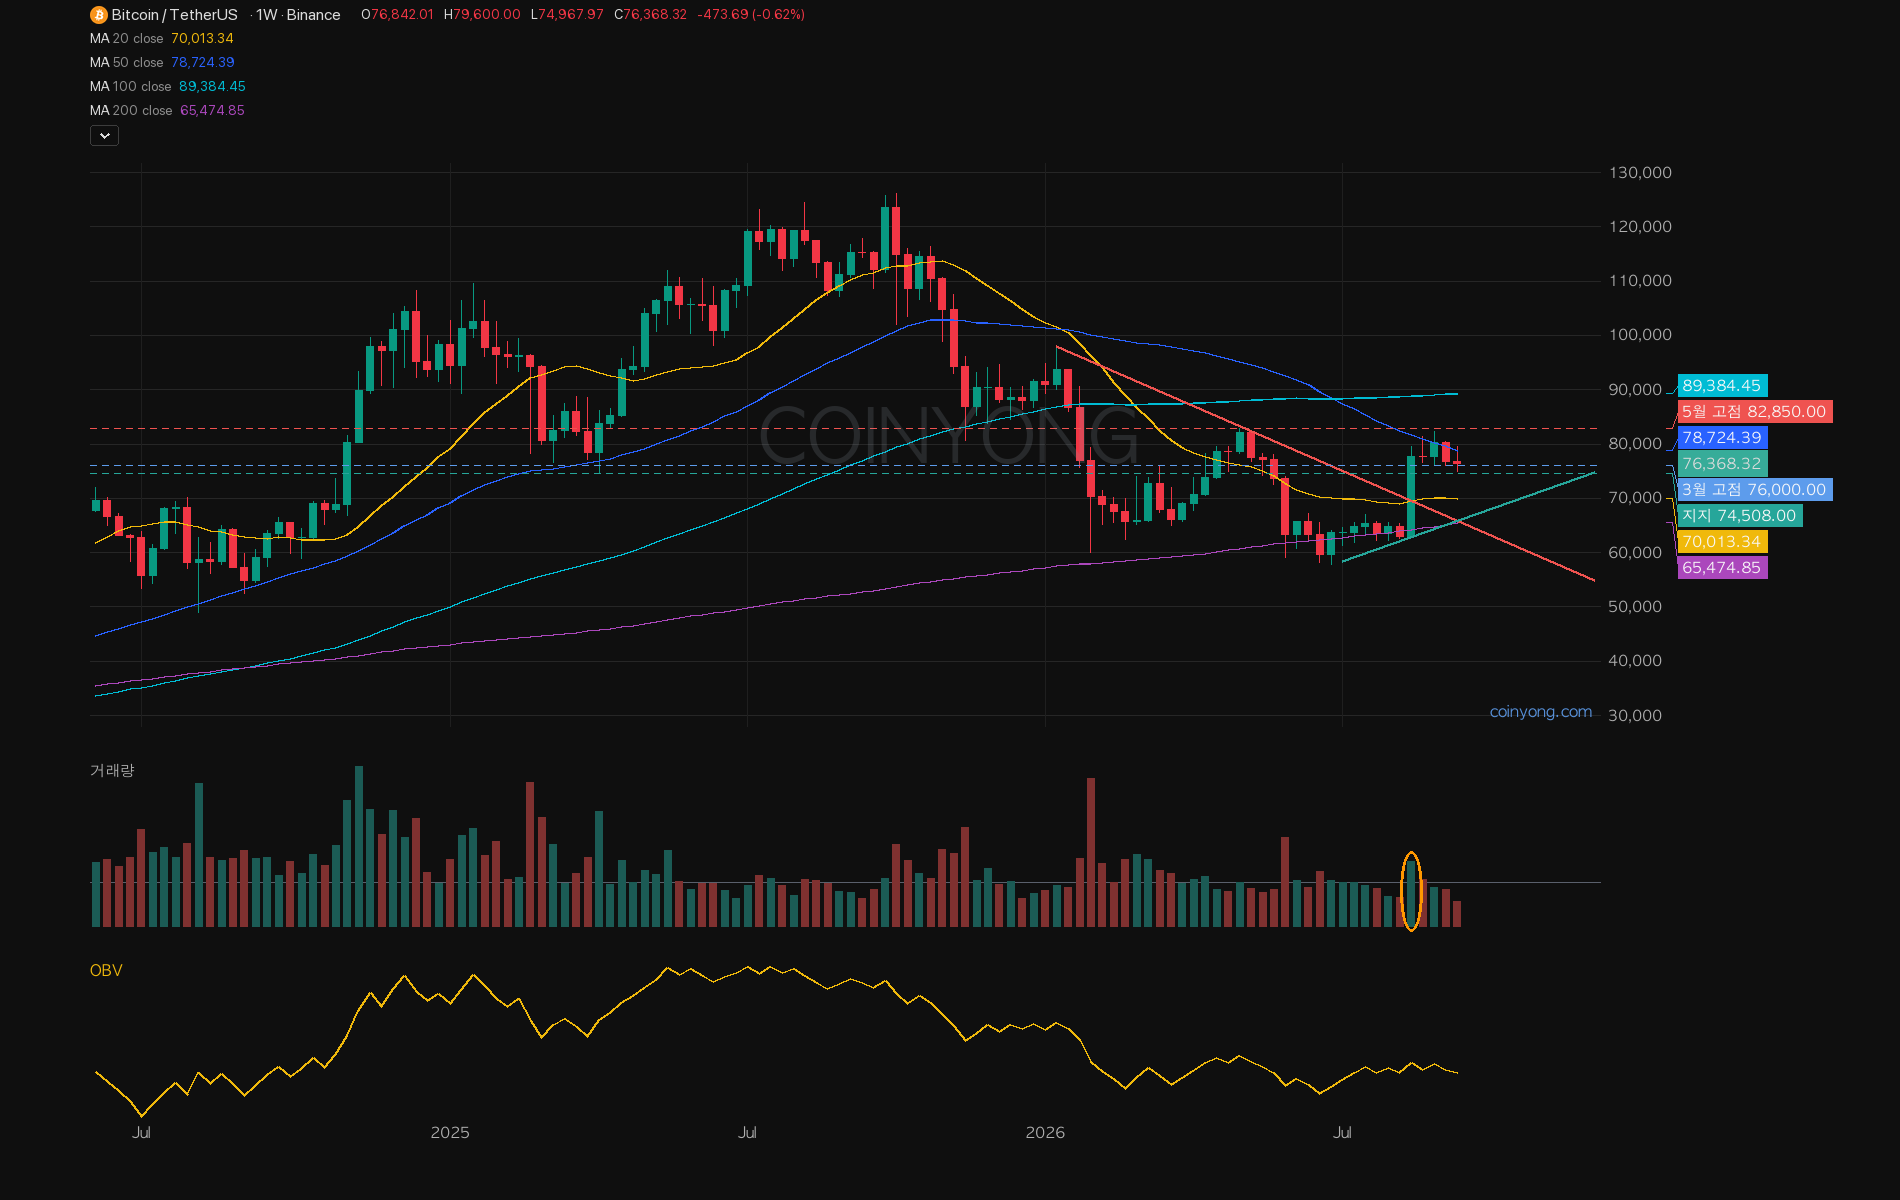
76000 is the March high, so as long as price stays above it, the bigger trend is still intact. The key is whether next week's weekly candle closes above this level.
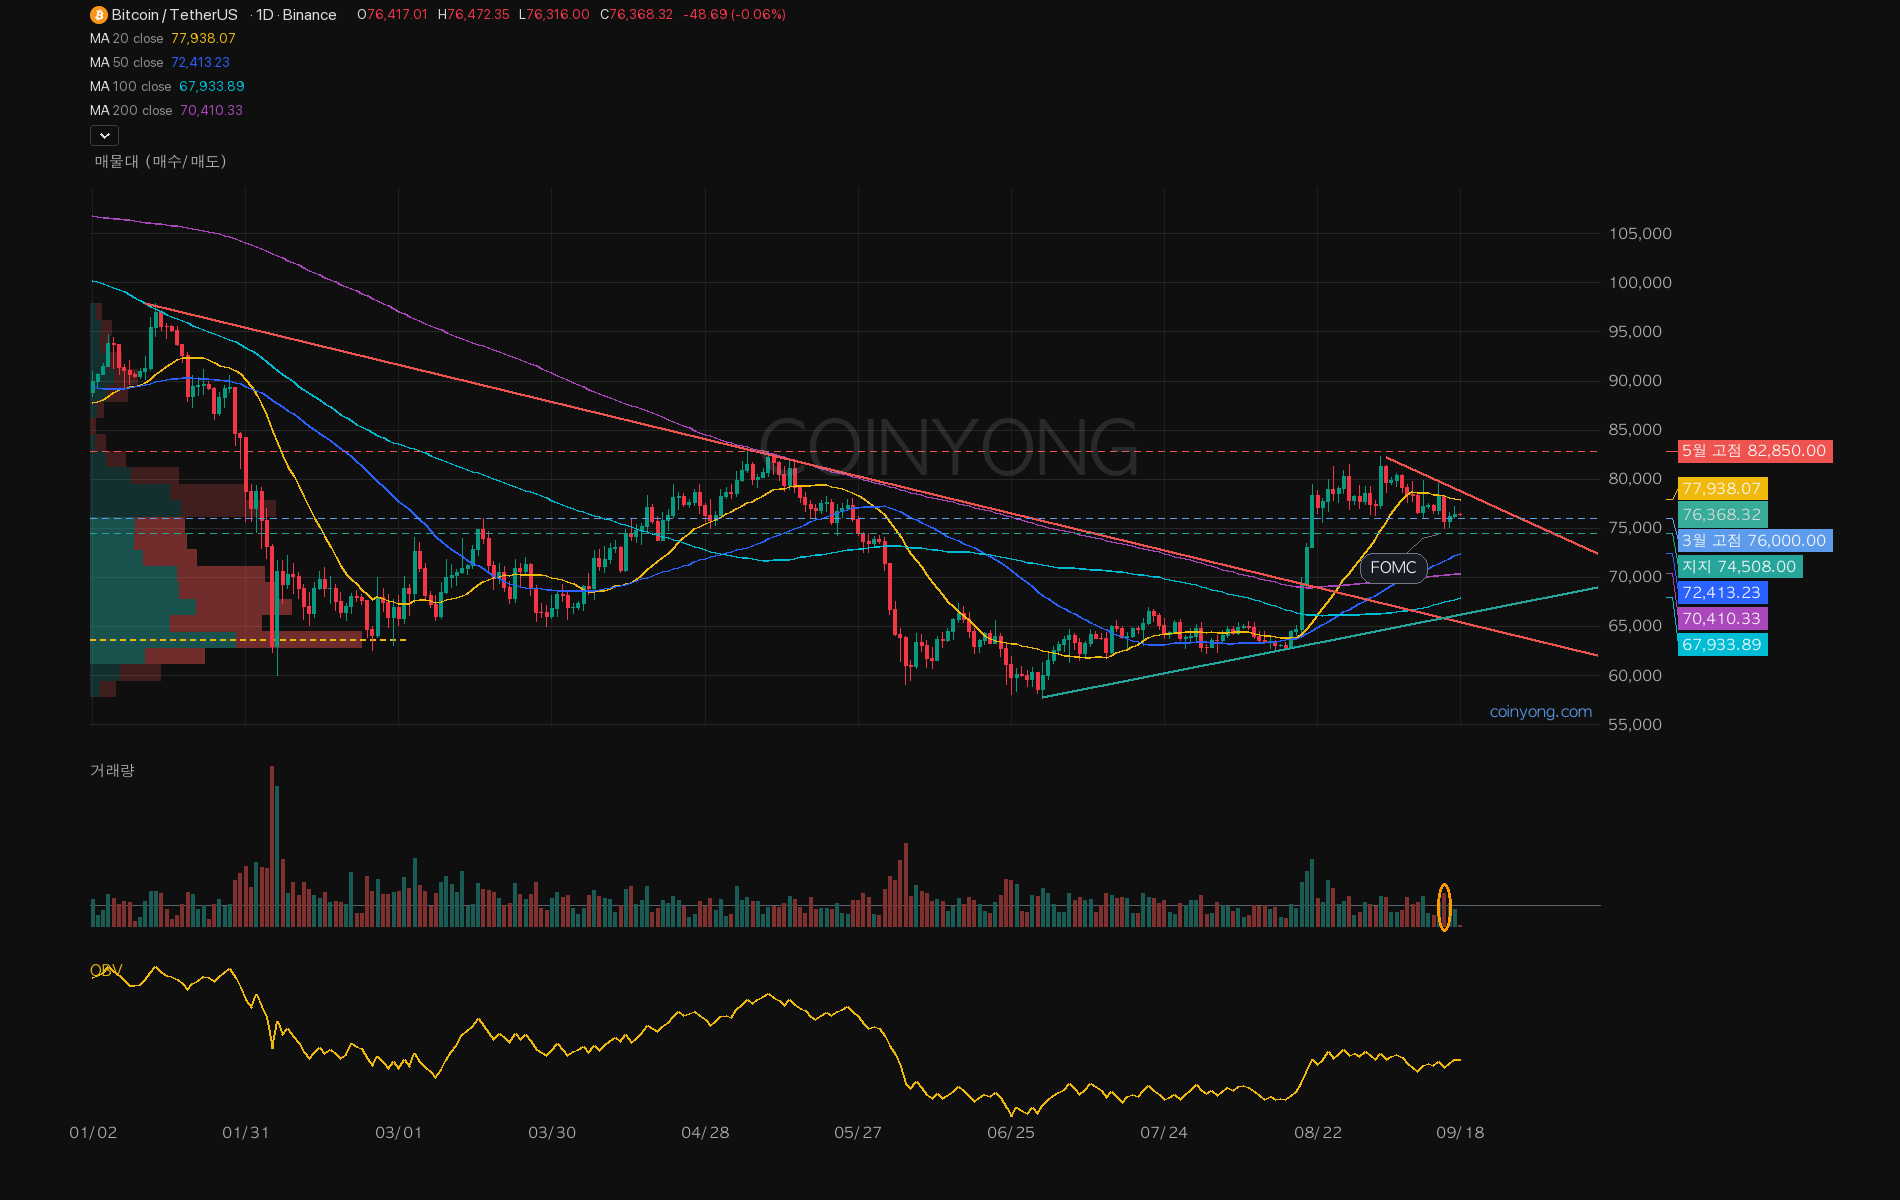
Above, there's thick supply stacked in the 77000s, which is why it tagged 77179 last night and got pushed back. Below, there's a bid wall at 75400, and under that, around 75000, is where liquidations are clustered.
Whales keep selling, yet price isn't dropping, which means buyers are absorbing the selling below. I think it tags 76000 once more over the weekend and then picks a direction. If 76000 breaks on the 4-hour, 75400 is next; if it clears 77332, higher levels come back into play.
It's the day after a rate hike and things are this quiet, which honestly makes me a bit uneasy. Where will it move next week...
 ETH
ETH LINK
LINK