ETH Settles Above 2465 — Next Up, the Fight at 2547
 Coinyong
 ETH
ETH
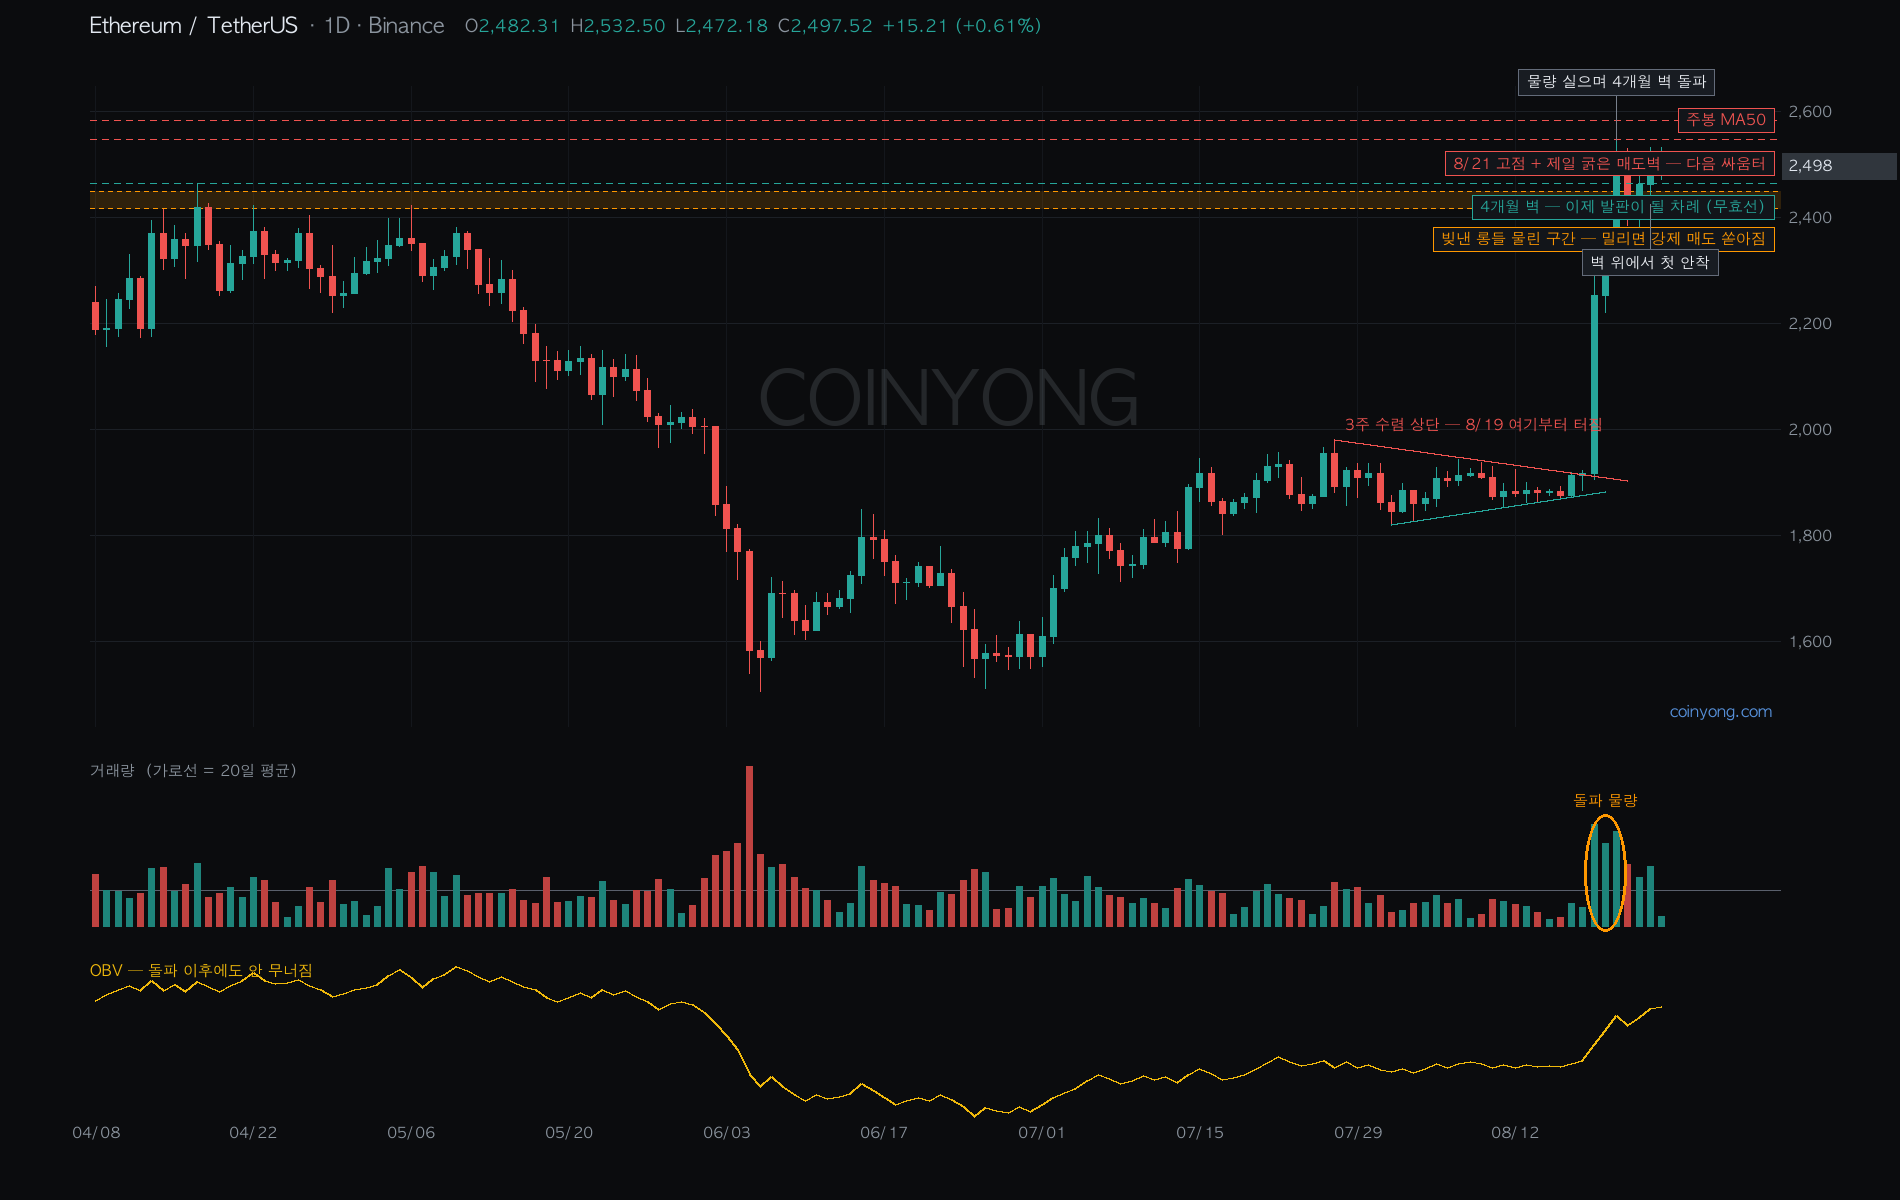
In my last post I said ETH was testing whether 2465 would act as support or resistance, and now we have the answer. It closed above at 2482 yesterday, and today's low is 2472. Even when it wobbles, it only trades above the wall. A level that capped price for more than four months is turning into support.
So the level to watch now is 2547. That's the 8/21 high, and the order book shows the heaviest sell orders sitting right at that price. When a prior high and a sell wall line up at the same price, you can expect a collision there. Honestly, even if it clears this, it's not a spot where things just rip open. There's another weekly MA right above at 2584, and the breakeven levels of people trapped since last year are still stacked overhead. Still, the current picture of holding with higher lows right in front of that wall isn't bad at all.
Below, there's a bid at 2462 holding things up, but under that, at 2417~2450, there's a pile of leveraged longs. If 2465 is given back on a close, the breakout has failed, and that's exactly where forced selling could pour out right below, so the drop could accelerate. I think that's the right place for the invalidation line.
A four-month wall flipping into support isn't something you see often, so I'm enjoying watching this. Just need to see how the 2547 fight plays out. Good luck, everyone.
 BTC
BTC LINK
LINK