Called ETH Heavy Yesterday — Then Whales Piled In
 Coinyong
 ETH
ETH
Yesterday I thought ETH looked a bit heavy overhead, but the internals shifted quite a bit in a single day. Bottom line: today I'm leaning more toward the upside. Let's start with the weekly to see why.
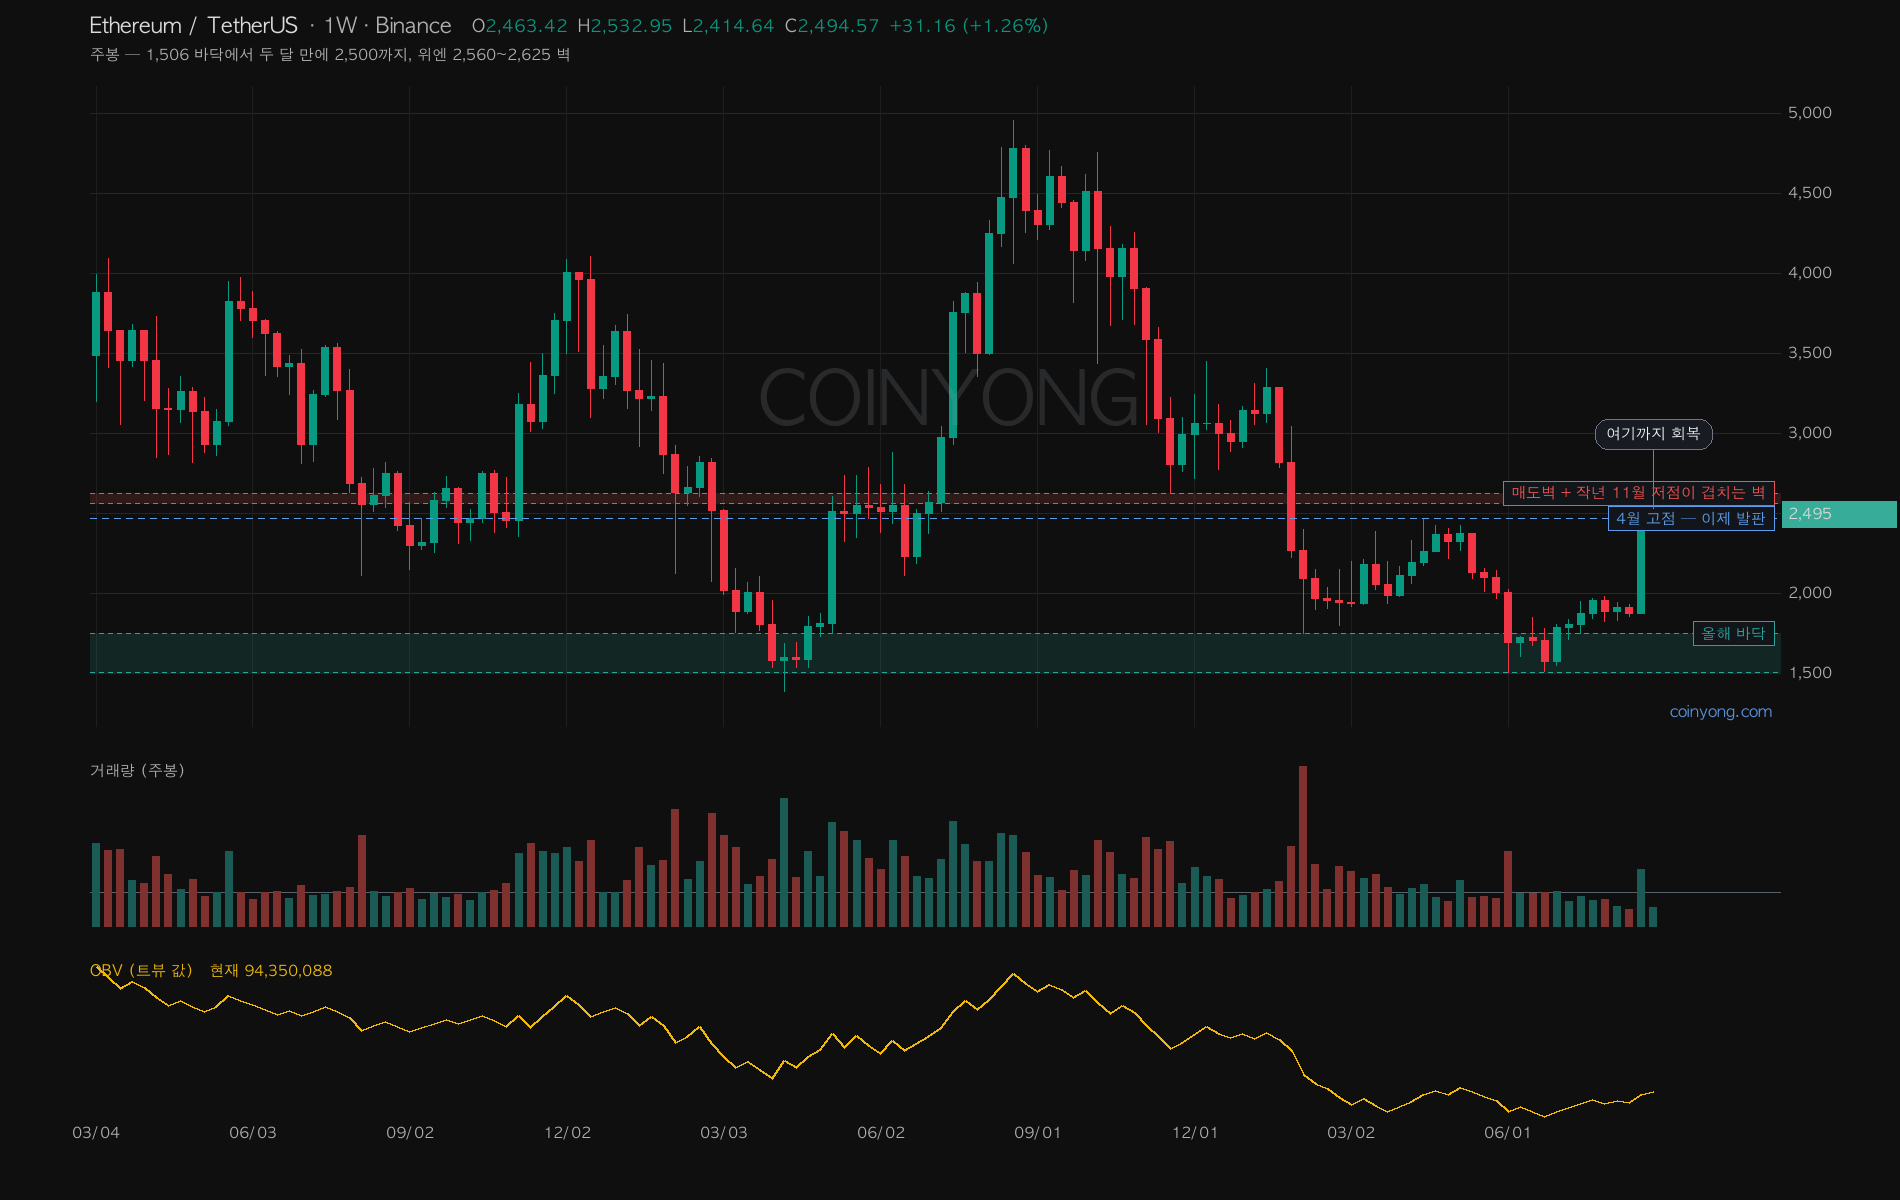
On the weekly, ETH topped at 4,957 last summer and slid all the way to 1,506 in June this year. From there it climbed back to 2,500 in two months, which is where we are now. Overhead, 2,560 to 2,625 is where sell-side supply overlaps with last November's low, so it's a zone it will likely bump into at least once. The big picture is a bottom, a bounce, and now a test of the first resistance.
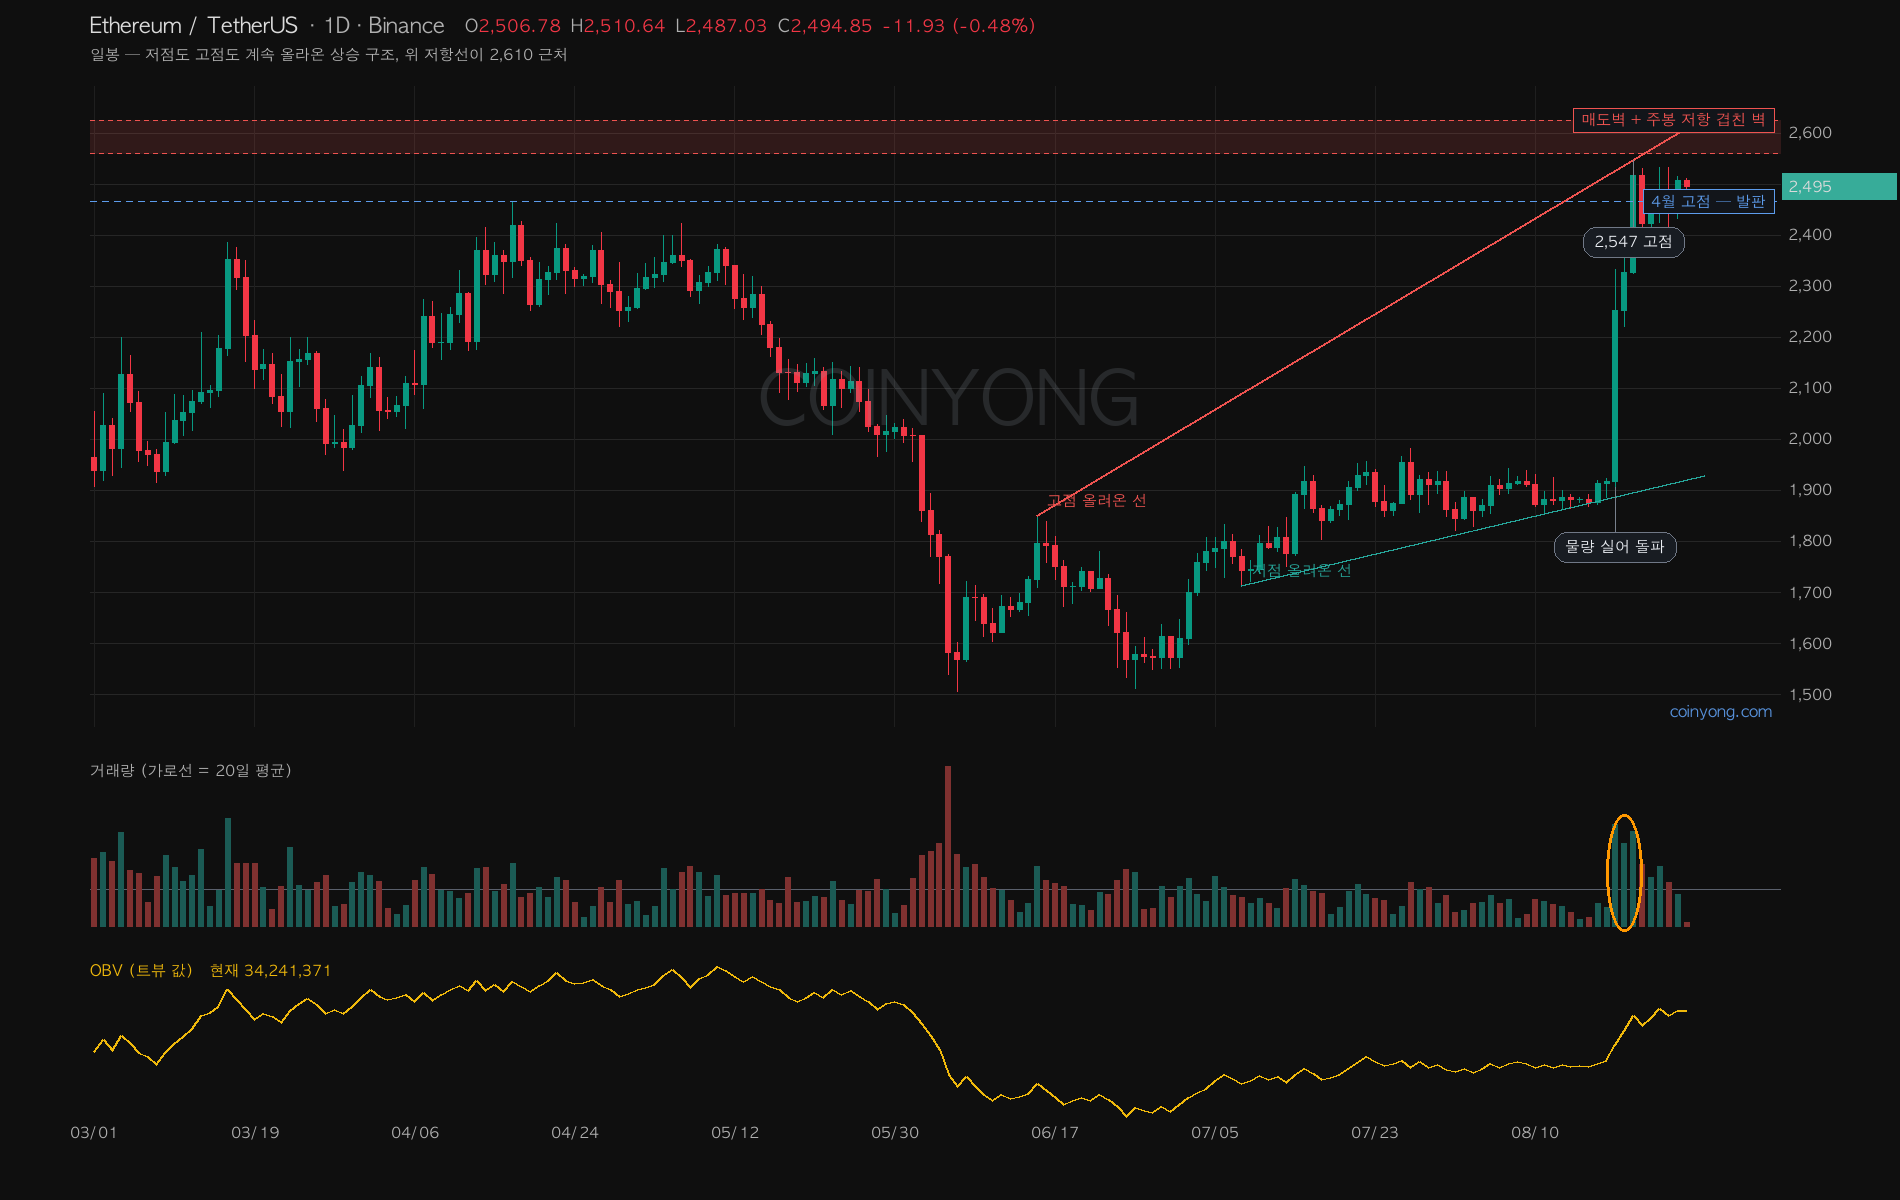
On the daily, ETH has a somewhat different texture from BTC. Since the June low, the lows have kept rising and the highs have risen with them, so the uptrend structure is cleanly intact. After jumping on volume on August 19, it has been using the April high of 2,465 as a foothold. OBV at the bottom of the chart is also rising with price, so the buying volume behind it hasn't faded. BTC made a new high without OBV following, but ETH doesn't have that problem — that's the biggest difference today.
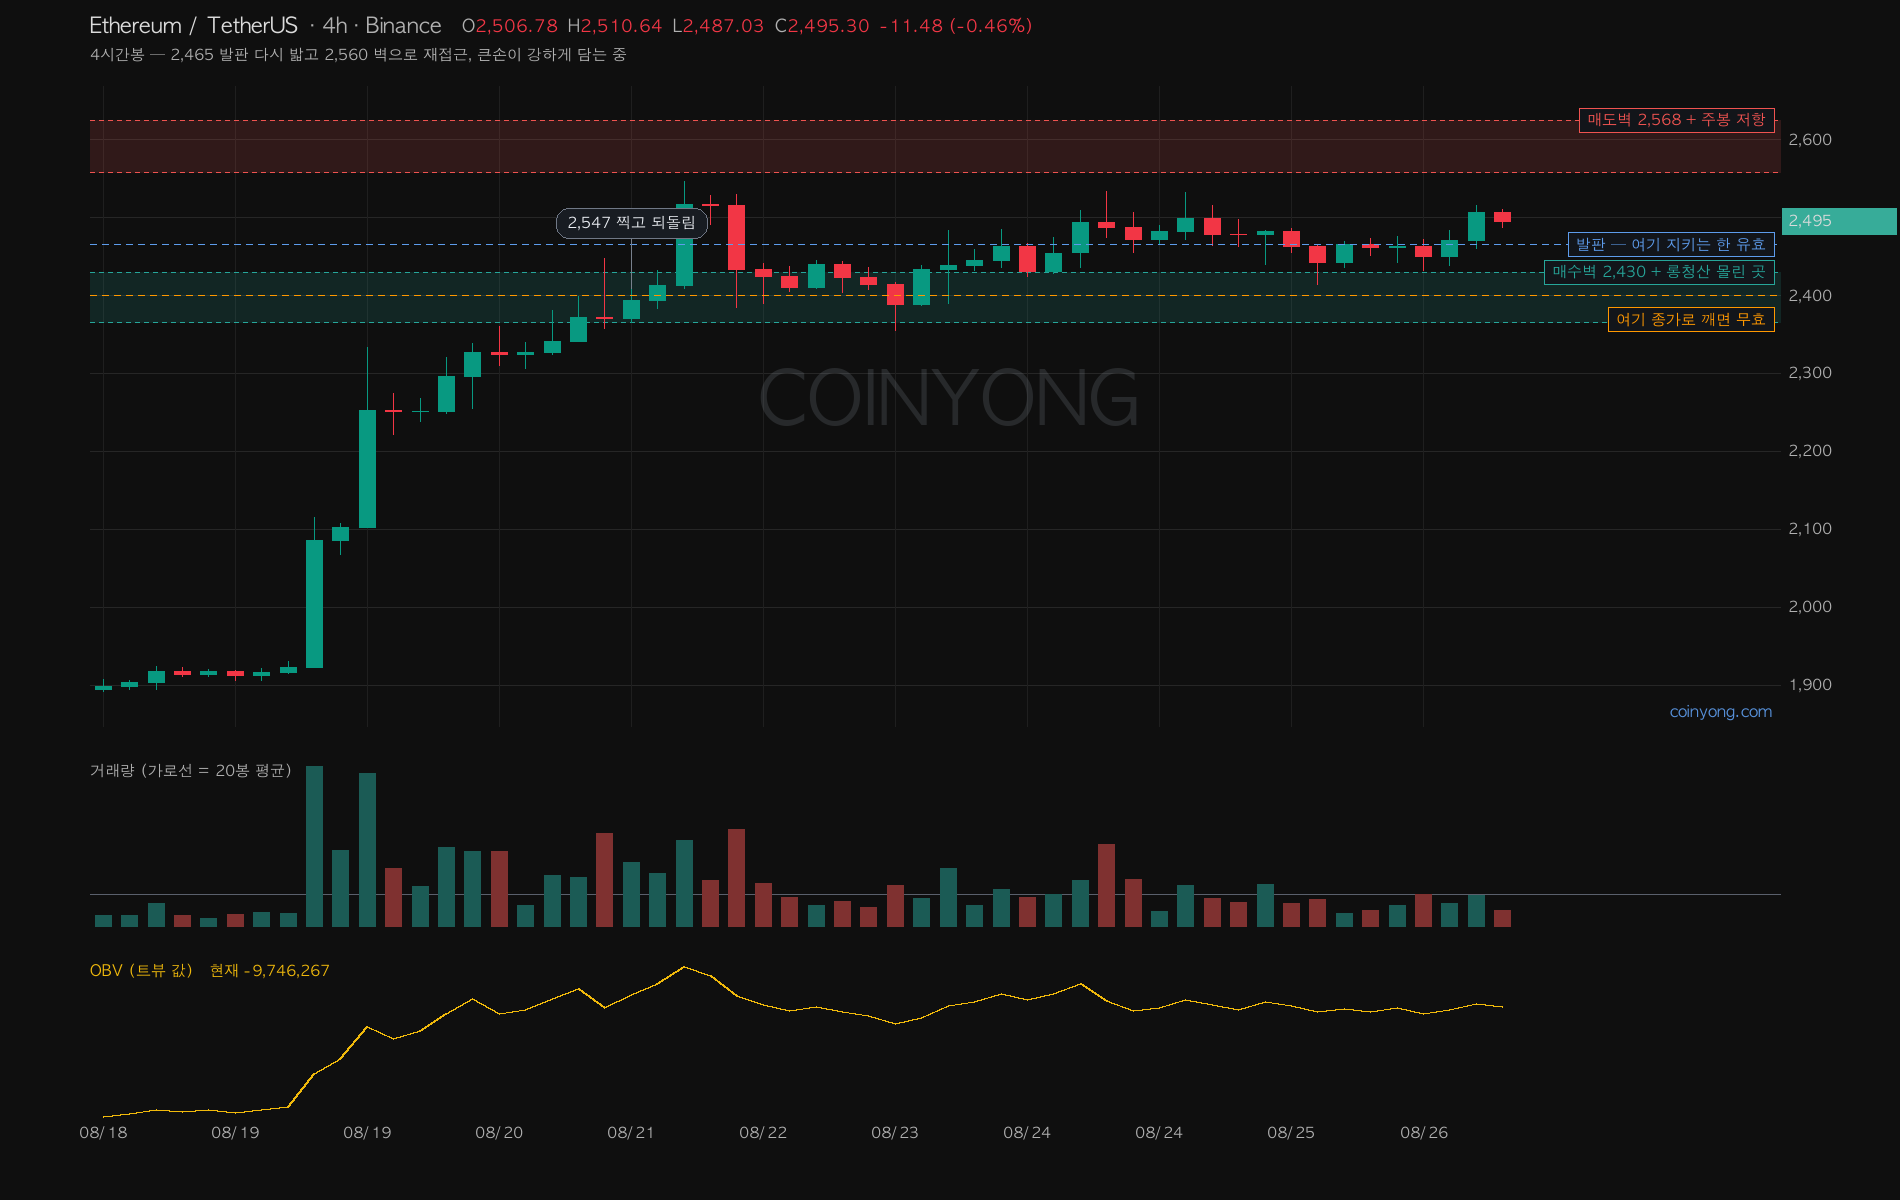
Zooming into the 4-hour, it briefly slipped below 2,465 yesterday, then immediately climbed back and settled on the foothold. And when I split today's trades by size, orders over $1M accounted for more than $100M in buys in a single day. That's far more aggressive buying than in BTC. Flipping direction like this within a day, from selling at the same level yesterday, isn't a common picture.
So I see this as a spot where it goes to test the 2,560 wall. Whales are buying this much while the indicators have actually cooled off from overheated levels, leaving more room to the upside. Break it, and supply above is thin, opening a path to the 2,700s. However, long liquidations are stacked below at 2,365 to 2,430, so if it closes below 2,400, it could get pushed there quickly. As long as that line holds, this time I'm betting on the wall breaking.
 BTC
BTC LINK
LINK