ETH Finally Moved — and Stalled Again Right Here
 Coinyong
 ETH
ETH
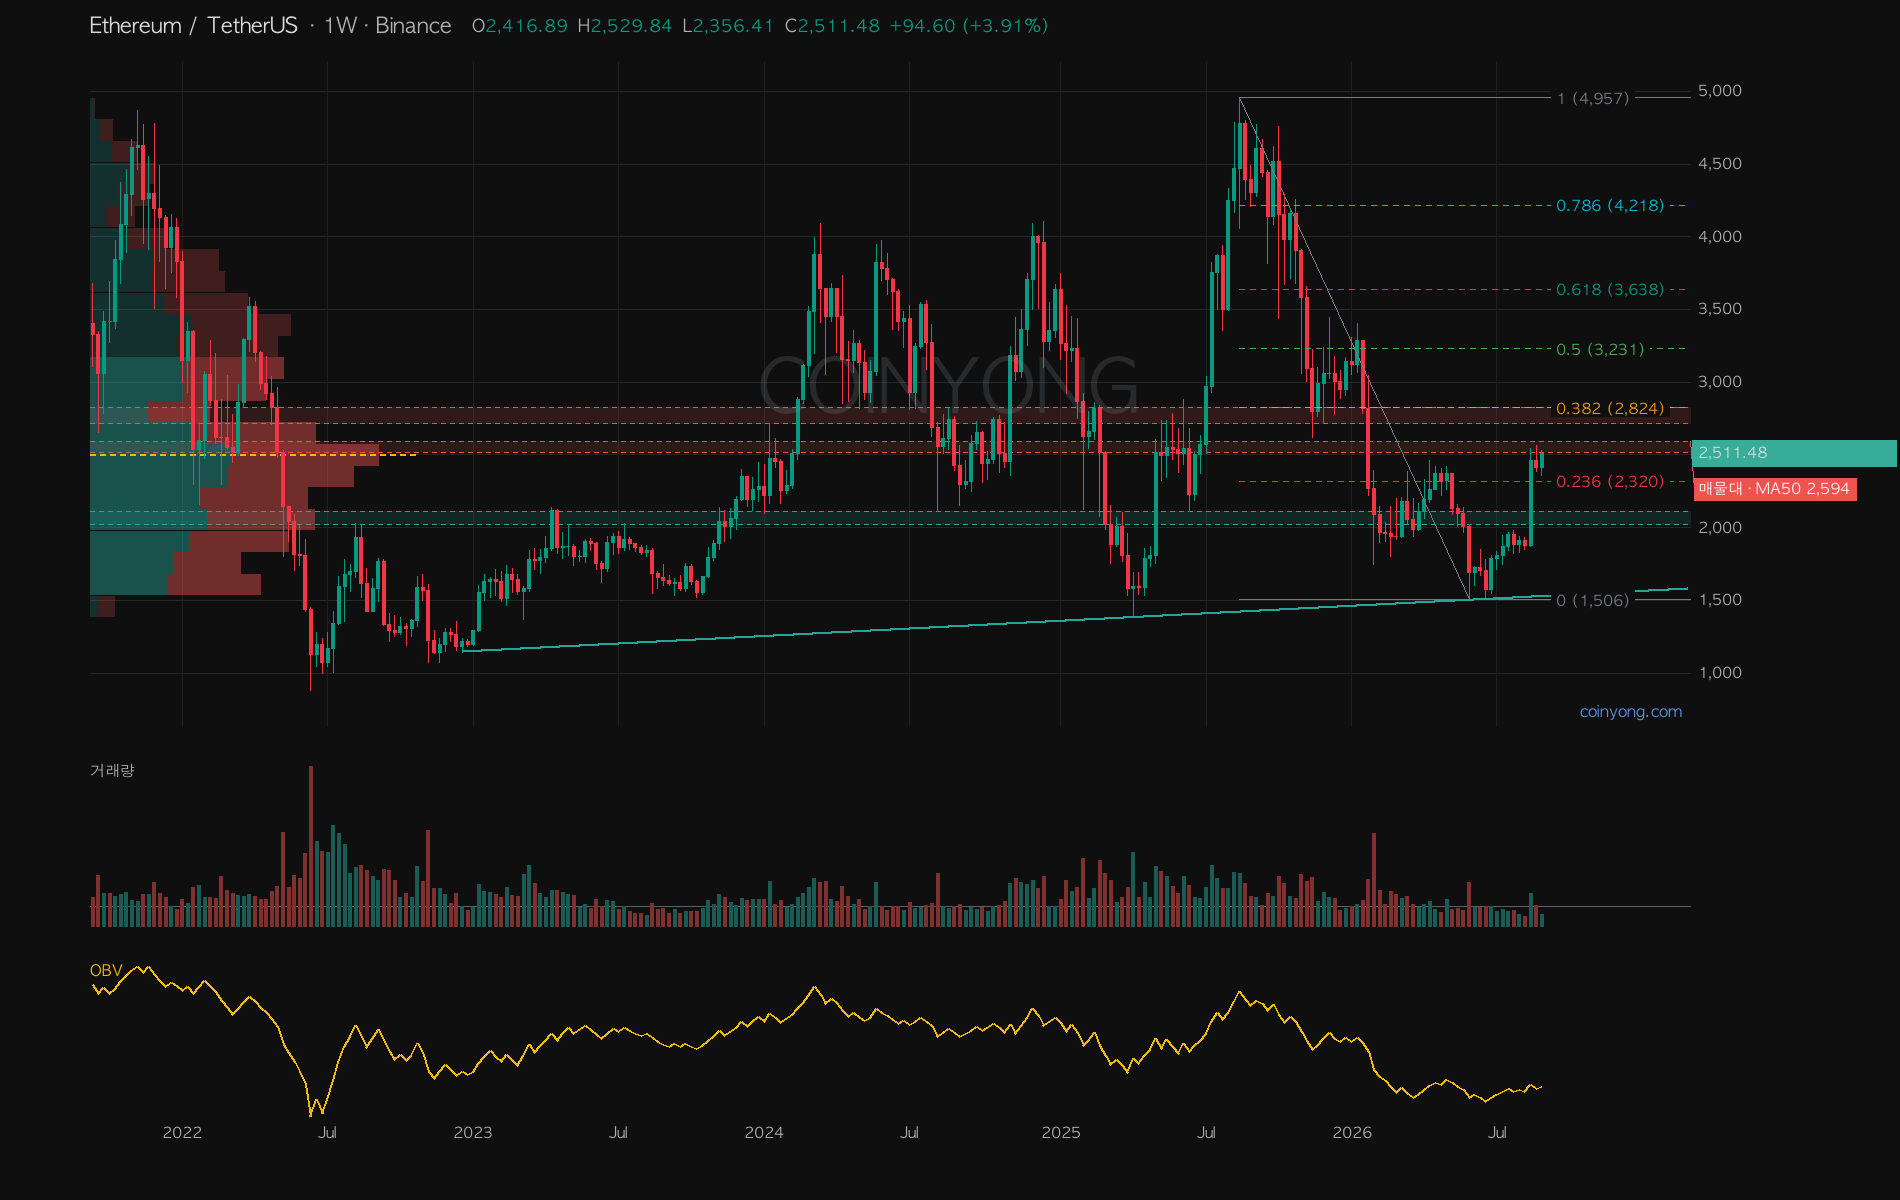
Ethereum (ETH) closed the September 3 daily candle at $2,507. In the previous post I looked at the 4-hour break of 2490 and the 2567 confirmation line; this time I widened the view to the 5-year weekly to see where the structure above and below comes from.
Laying out five years of weekly candles, the December 2022 low at $1,151, the April 2025 low at $1,385, and the June 2026 low at $1,506 connect into a gently rising long-term support line. Its current projection is around $1,530, well away from the current price. On the other hand, since the 2025 high at $4,957, bounce highs have been getting lower, so the structure combines a rising long-term floor with capped mid-term highs.
On the current weekly candle, the MA50 sits at $2,544 and the upper Bollinger Band is around $2,594. The core zone of the long-term volume profile, 2517–2576, overlaps as well. Getting above 2500 is a change, but it hasn't yet fully cleared a long-established trading zone.
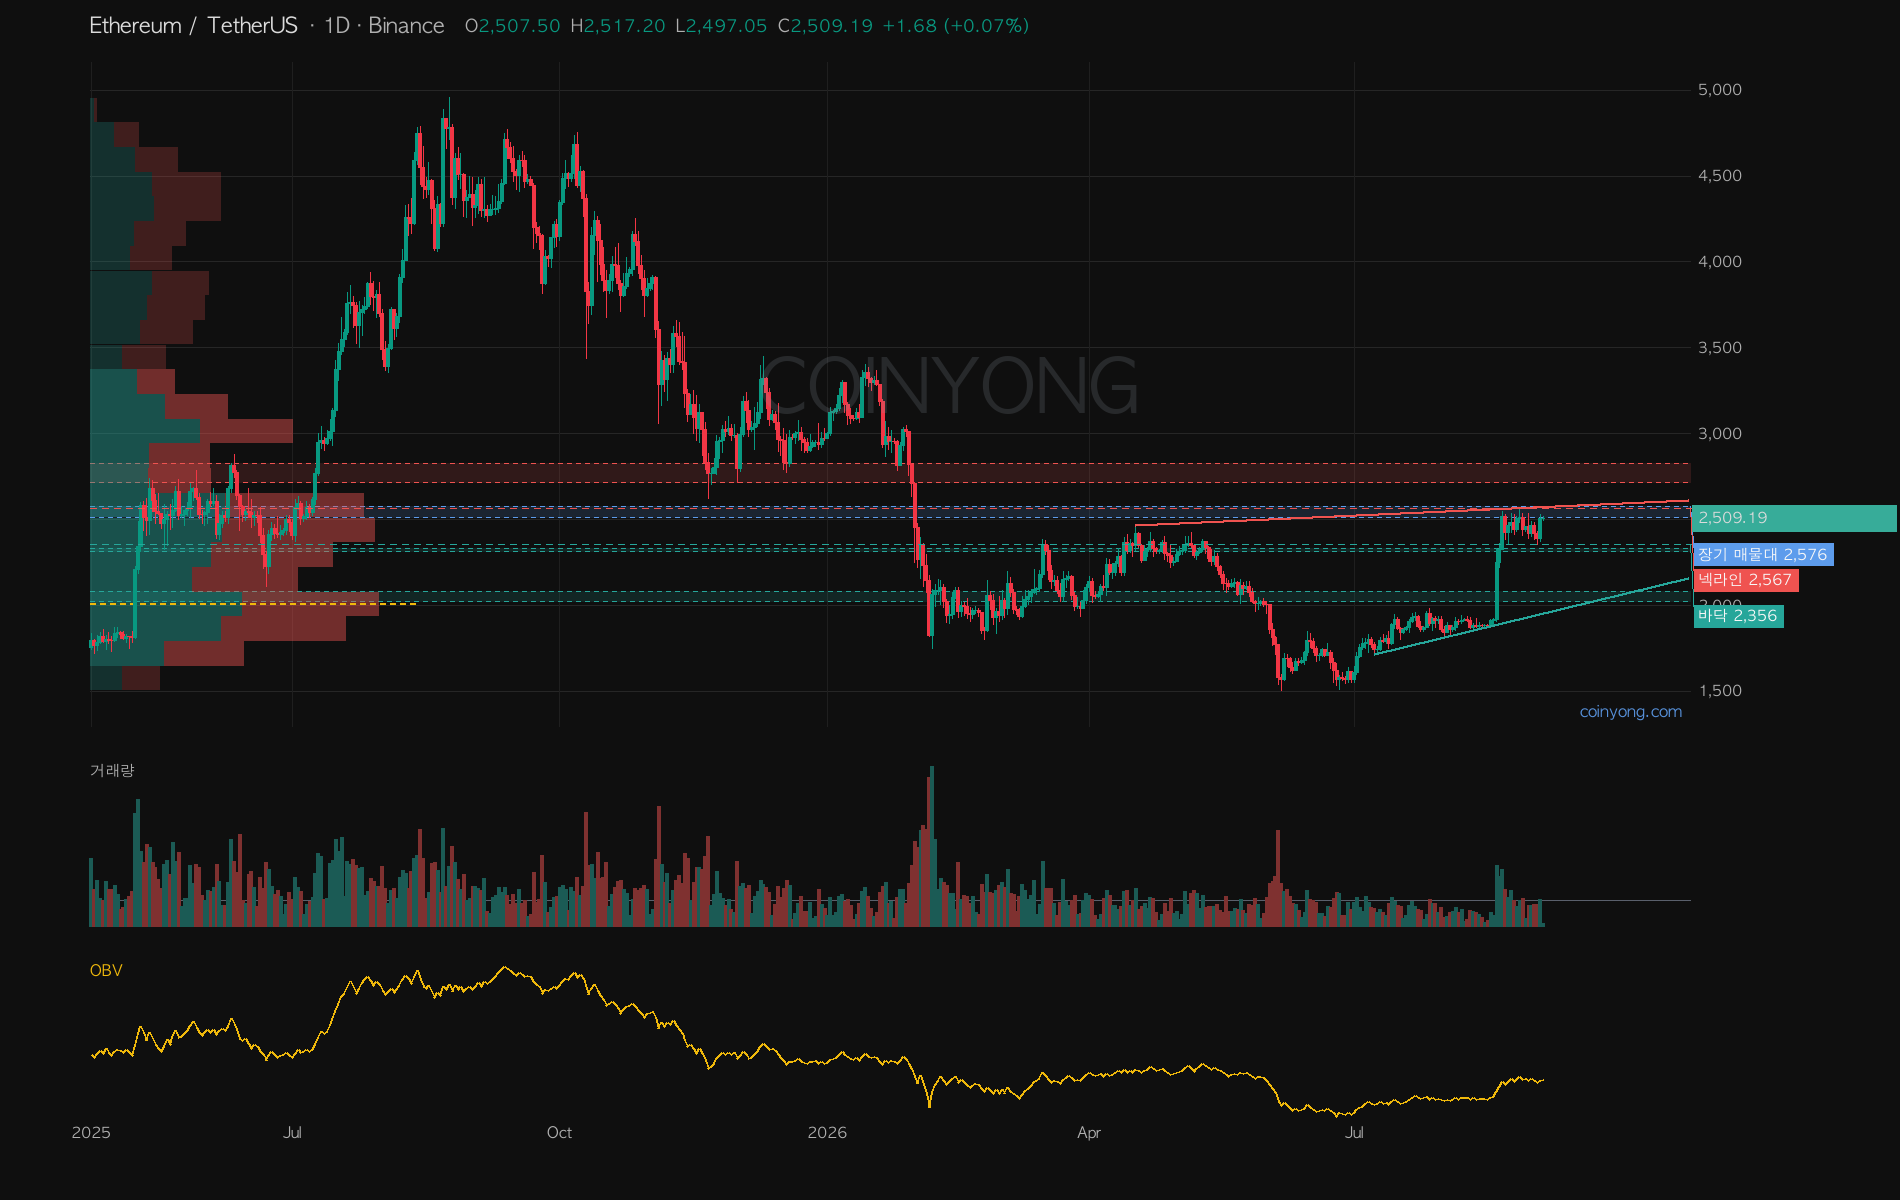
On the daily since last spring, volume splits into two clusters at about $2,000 and $2,500. Price is currently passing through the upper cluster, and the line connecting the April 17 and August 27 highs also runs near $2,572. Daily 2567 and weekly 2594 may look similar, but they're confirmed on different timeframes.
The short-term picture is the same as in the previous analysis. The small W on the blue line cleared 2490, and the large purple W remains only a candidate until it clears 2567. This move explains the short-term bounce, but it doesn't change the long-term rising support near $1,530.
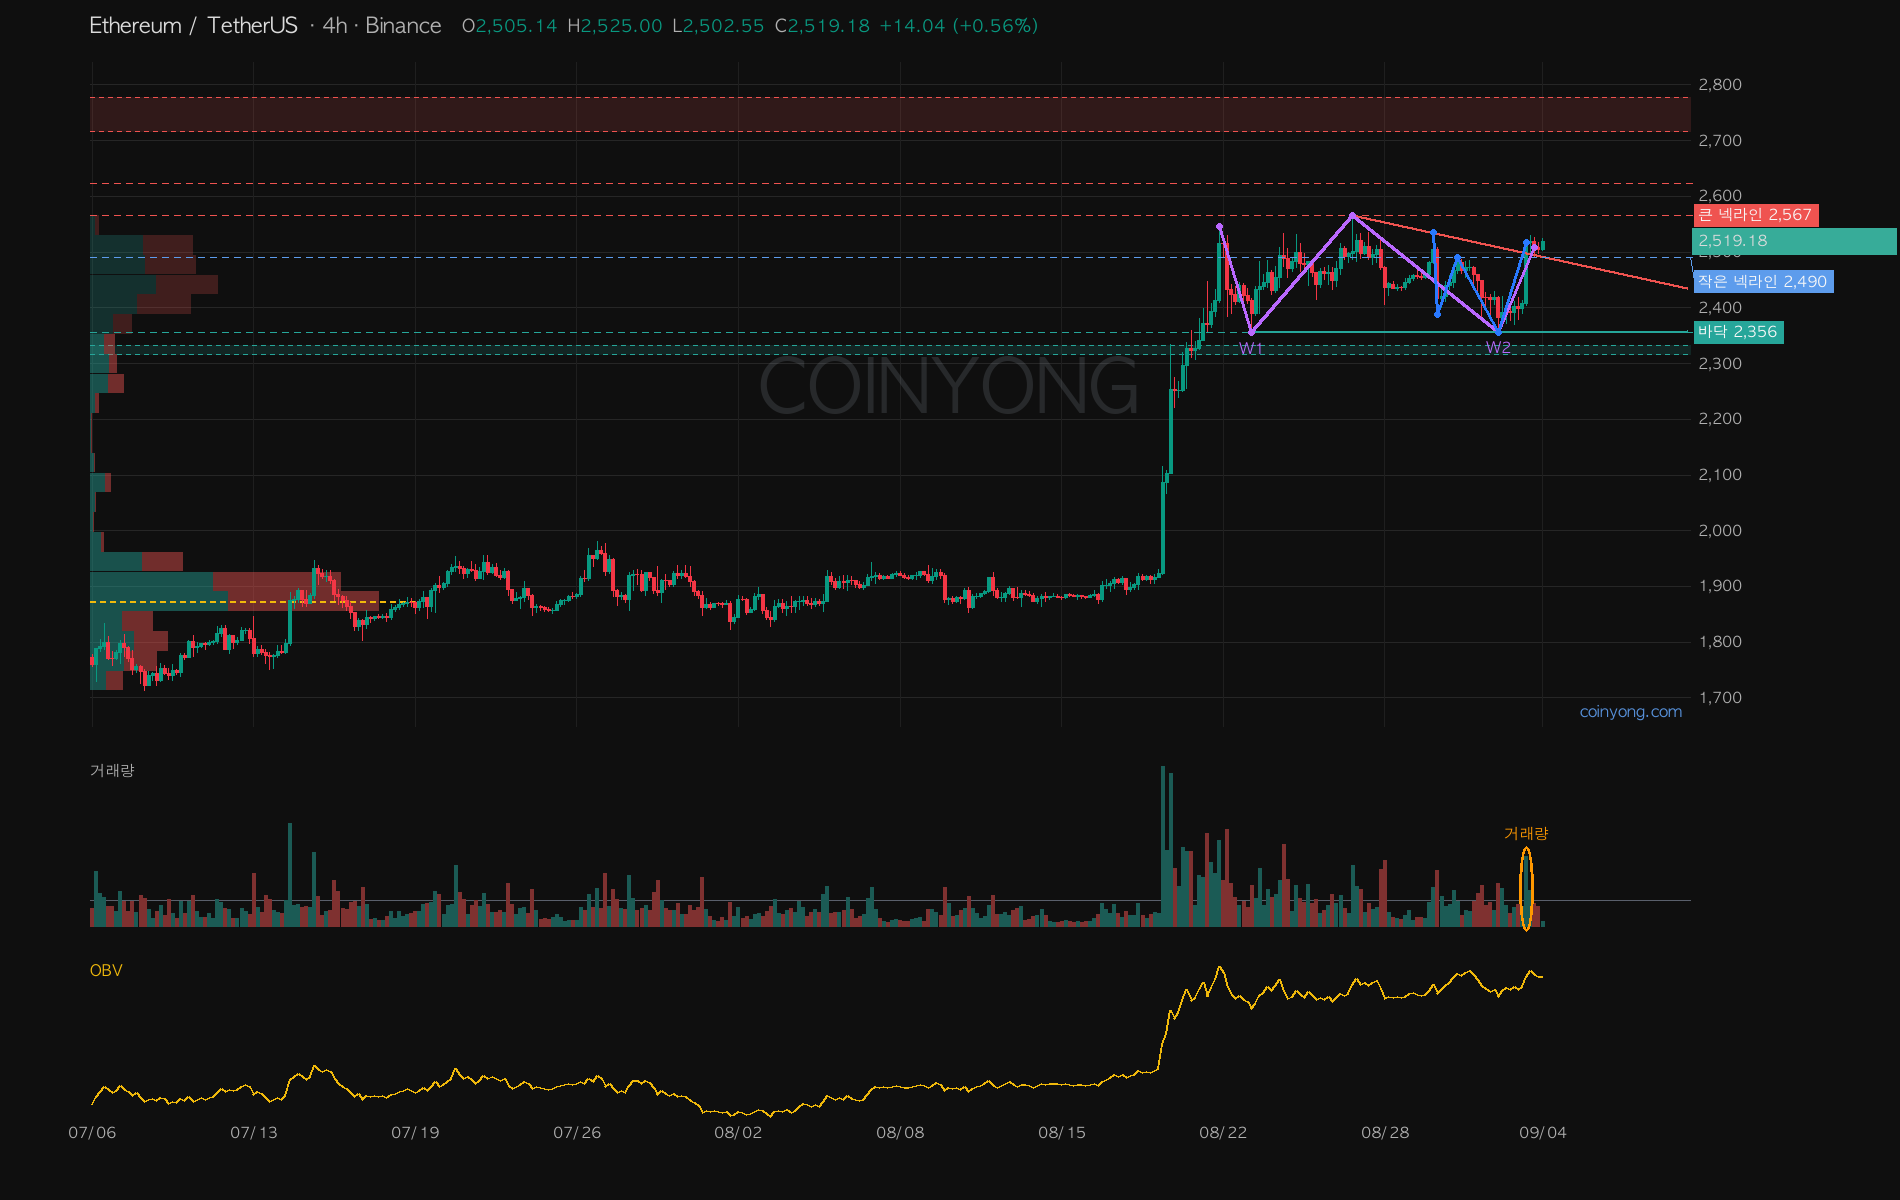
If a 4-hour candle closes back below 2490, the small W breakout is invalidated, and a break below $2,356 invalidates the large W candidate as well. Conversely, a daily close above 2567 followed by a weekly close above 2594 opens 2717–2824 as the next zone to confirm.
The same $2,500 is a post-breakout price on the 4-hour but a zone it has struggled against for a long time on the 5-year weekly. What to watch in this post isn't one overnight move, but whether the weekly can close above 2594.
 BTC
BTC LINK
LINK