Uniswap Breaks $6 on Robinhood Chain Volume
 Coinyong
 UNI
UNI
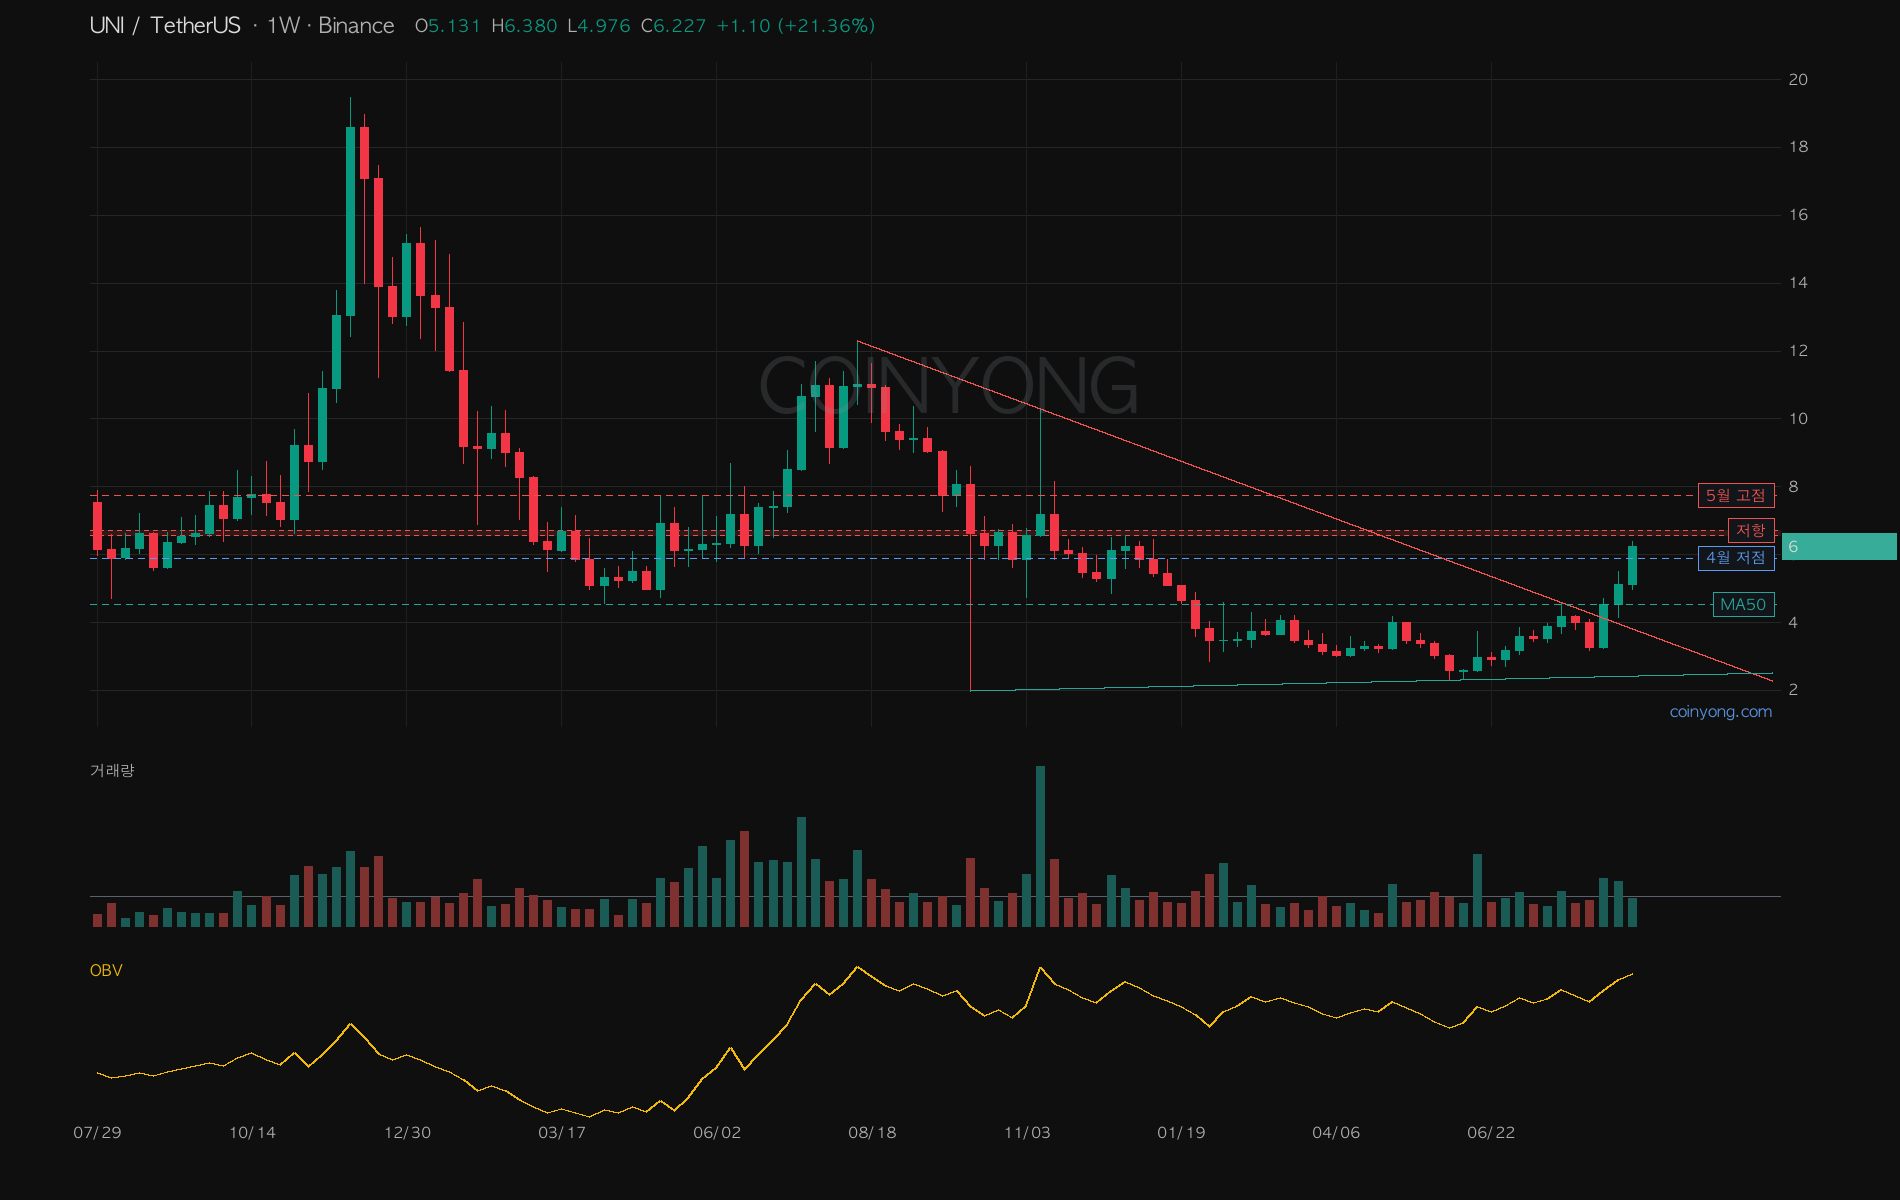
On Wednesday afternoon, most of the big-name alts were sliding and the DeFi sector was weak too, yet Uniswap (UNI) climbed above $6 on its own.
On Robinhood Chain, trading in tokenized stocks has been picking up, and Uniswap's volume has grown along with it. (Volume data)
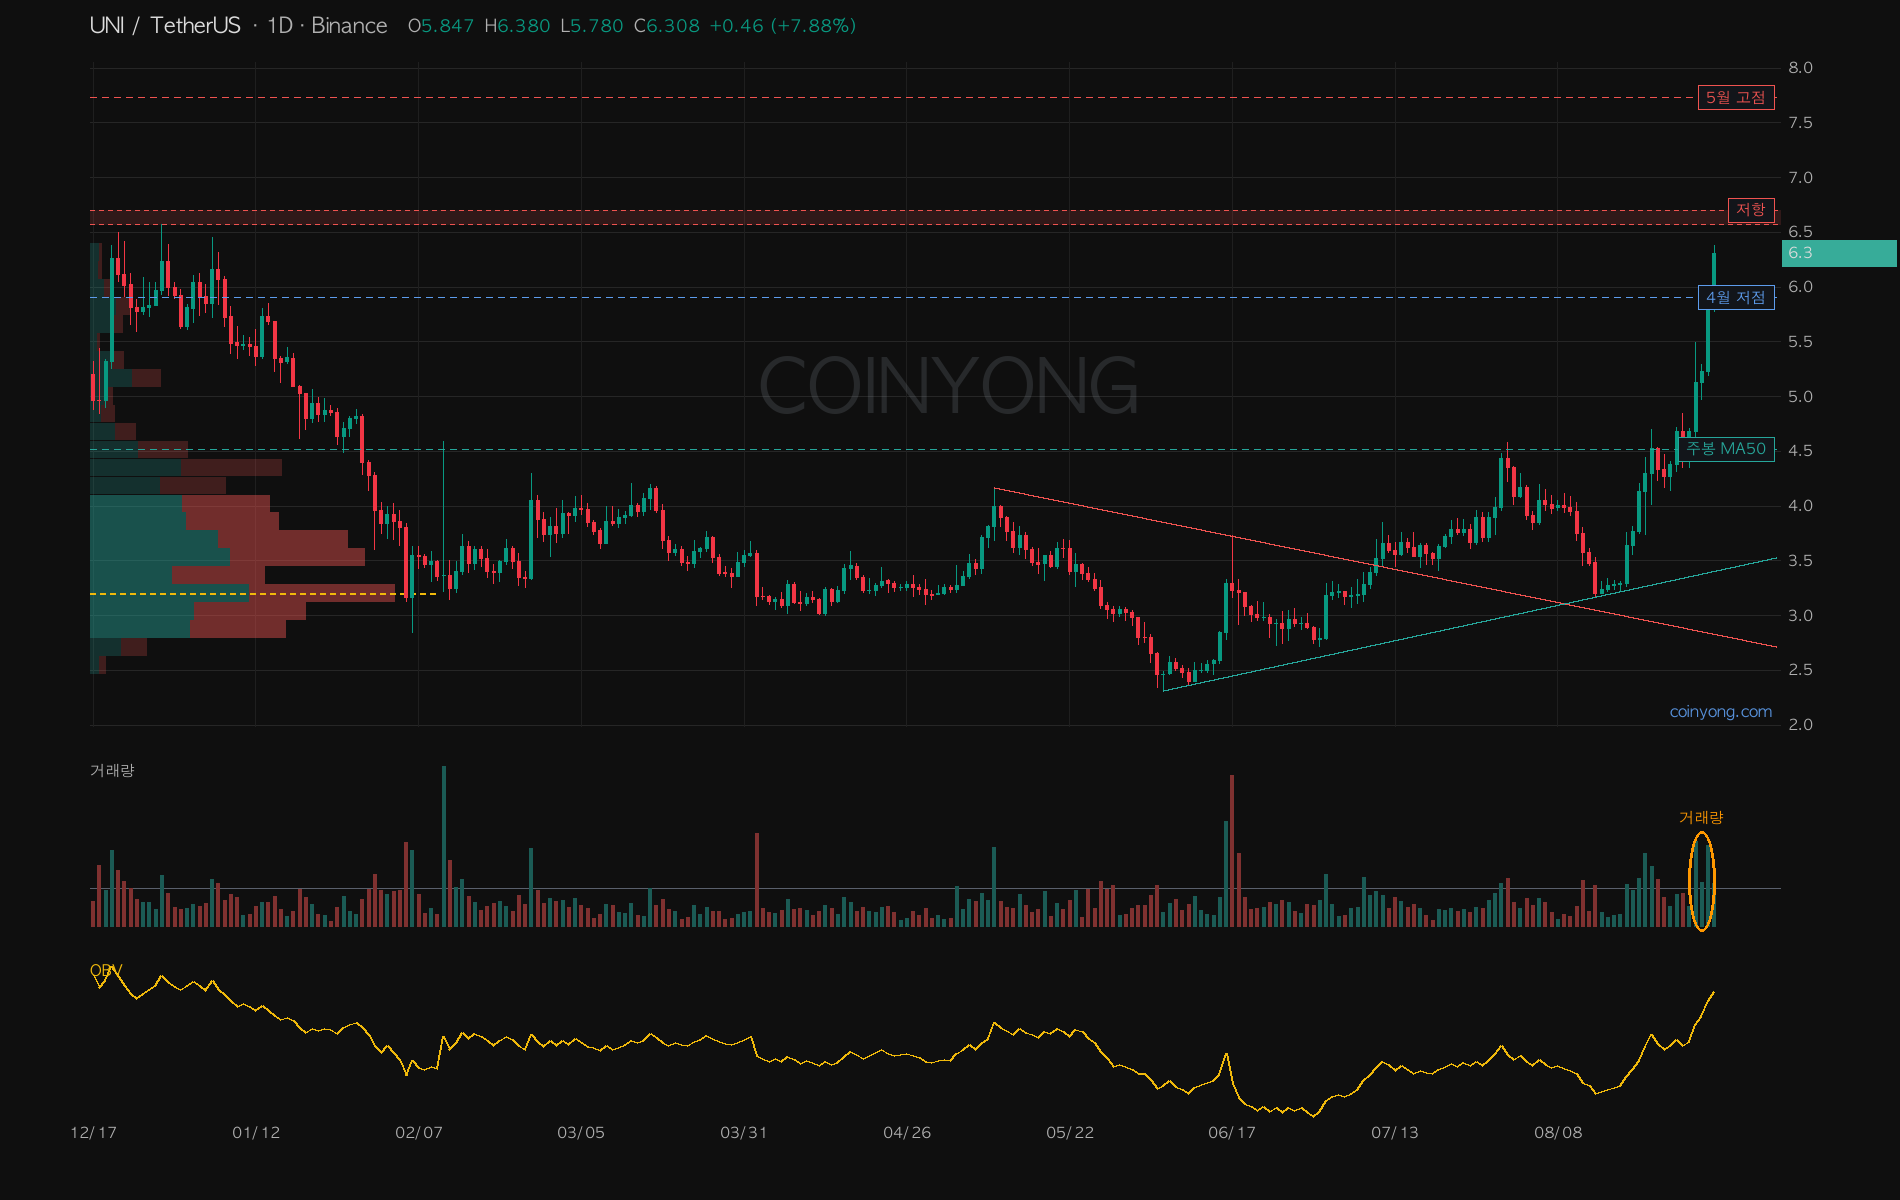
Price nearly doubled, from $3.17 on August 14 to an intraday high of $6.38 today, and it cleared both the long downtrend line and $5.90 on volume.
Today's candle is at $6.23 as of 2:45 PM, so it's still in progress, and the $6.57~6.70 weekly resistance sits right overhead.
Mid-sized orders remain net buyers, but $1M+ large orders have been net sellers on a rolling one-day basis, so flows aren't as one-sided as the price action suggests.
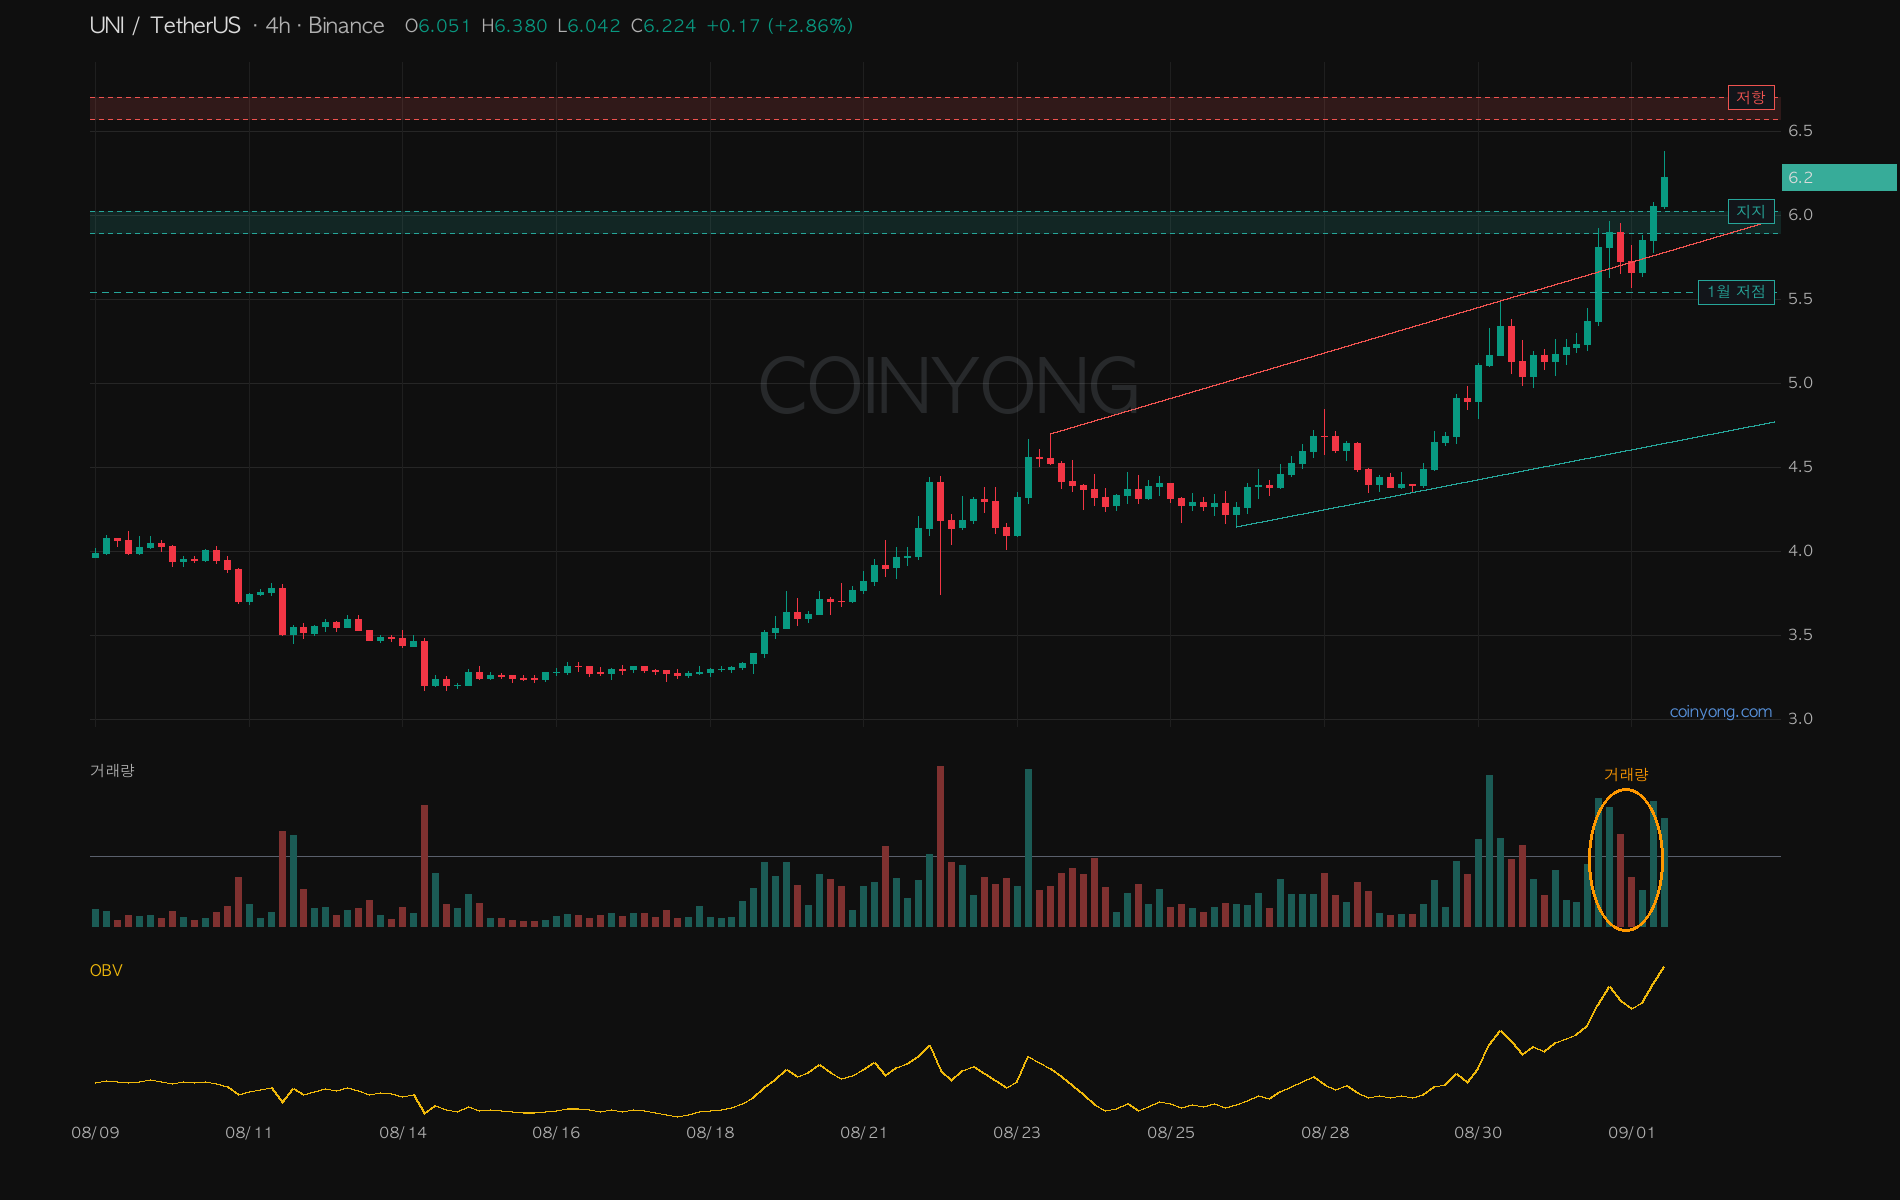
On the 4-hour, the 9 AM candle closed above $6, giving one confirmation of the breakout. A daily close above $6.57~6.70 would open the next weekly resistance at $7.62~7.73.
Conversely, a 4-hour close below $5.90 invalidates this short-term rally, with $5.54 below that as the next level to check.
Right now this looks less like the start of a DeFi rotation and more like an individual catalyst, Robinhood Chain, driving Uniswap's price higher.
 ETH
ETH BTC
BTC LINK
LINK