XRP Holds $1: +27% in Two Days, but the Floor Is Empty
 Coinyong
 XRP
XRP
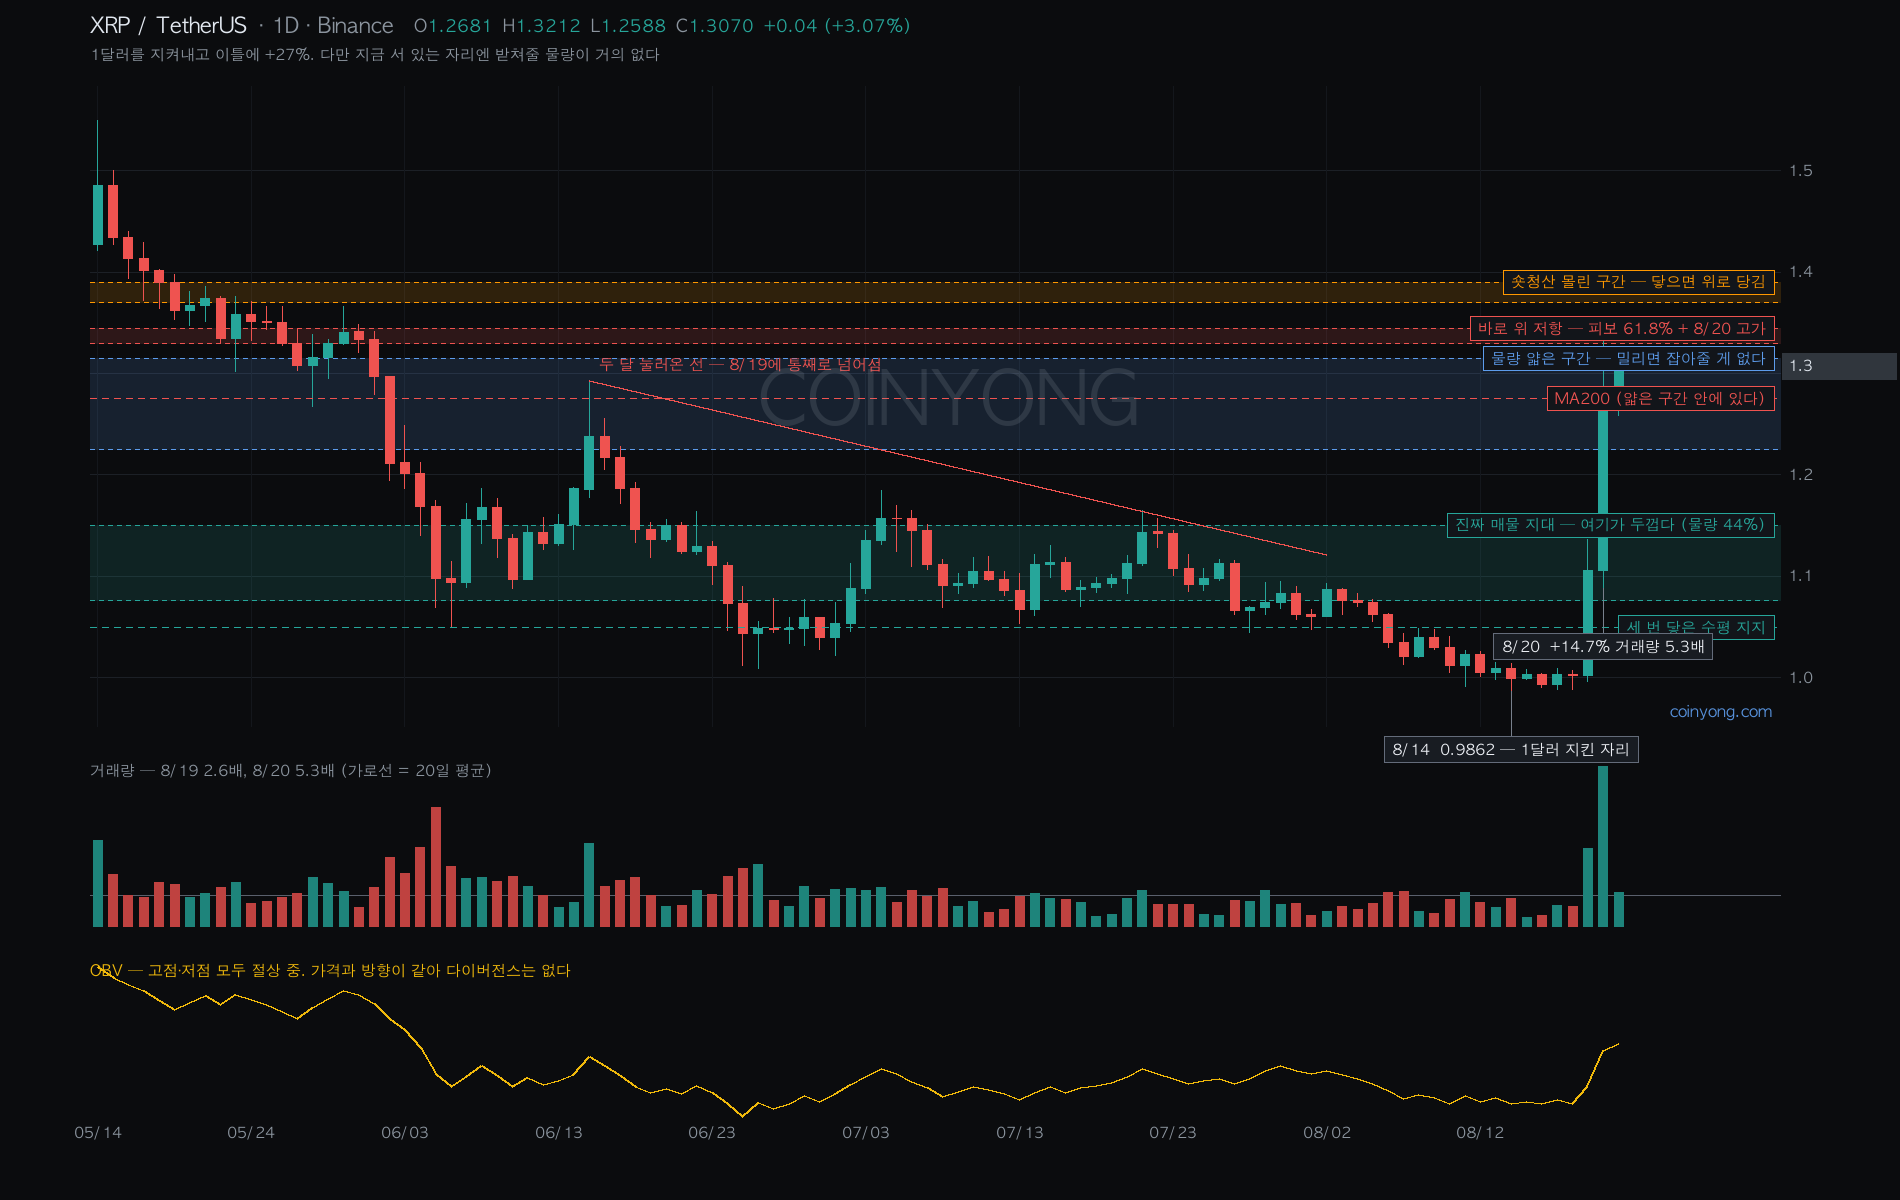
Two days ago I wrote that "this is the line in the sand." And it actually turned right there.
It dipped to 0.9862 on 8/14 and bounced, then went +10.4% on 8/19 and +14.7% on 8/20. That's +36% off the low, and +27% in just the last two days.
Real volume came in. On 8/20 it hit 5.3x the 20-day average. BTC was 2.8x and ETH 3.2x, so XRP had the strongest volume surge of the three. OBV is also making higher highs and higher lows, so it's not diverging from price.
And it reclaimed the MA200 (1.2752). The two-month downtrend resistance (the line connecting the 6/15 high and the 7/21 high) was cleared outright on 8/19 as well.
But where it's standing right now is a bit precarious
This is the most important part of the chart. There's almost no volume built up at the current price.
If you split the last 80 days of traded volume by price, the area around 1.30 holds only 0.9% of the total. The other 99% sits below. That's because price ripped through this zone in just two days.
That cuts both ways. There's little supply overhead, so it can move up easily. But once it starts slipping, there's nothing to catch it until 1.22. The middle is empty.
The truly thick zone is 1.08~1.15. A full 44% of total volume is concentrated in that one area.
Hard to trust the MA200 as support
People usually say that once you clear the MA200, that line turns into support. But right now the 1.2752 level also sits inside the thin-volume zone. A line passing through doesn't create volume.
So this is where I set the invalidation. A daily close below 1.2248 means this bounce has lost steam. That's where volume starts thinning out, so losing it means a fast move lower. A brief intraday poke doesn't count.
How far up?
1.33 is the 61.8% retracement of the drop from the May high (1.55) to the August low (0.9862), and 1.3441 is yesterday's high. Price is at 1.30 now, right below that.
There's something interesting above that. Short liquidations are clustered at 1.36~1.37. If price gets there, shorts are forced to cover, adding further buying pressure. Other coins have long liquidations stacked below, but XRP has the opposite shape.
RSI at 79.7: time to sell?
I'm not one to sell just because RSI is high. I once got curious and counted past cases, and more often than not price kept going after pushing past roughly 80.
ADX, which measures trend strength, is at 31.9. BTC was at 24.4 and ETH at 26.4, so XRP is the strongest of the three. Bullish directional strength is more than four times bearish directional strength.
The Kimchi premium is -1.25%, i.e. negative (Korean exchanges are cheaper than global). This rally wasn't driven by Korean buyers.
Bottom line
XRP held $1 and reclaimed the MA200 on a volume-backed bounce. The bias is still to the upside.
That said, the ground beneath the current price is empty. A daily close above 1.3441 lets the short-liquidation cluster overhead fuel a further run, while a daily close below 1.2248 means there's nothing in between to catch it until 1.15.
Investment decisions are your own responsibility; this post is for reference only.
 ETH
ETH BTC
BTC LINK
LINK