XRP Lost 1.31 and the Bounce Has No Strength
 Coinyong
 XRP
XRP
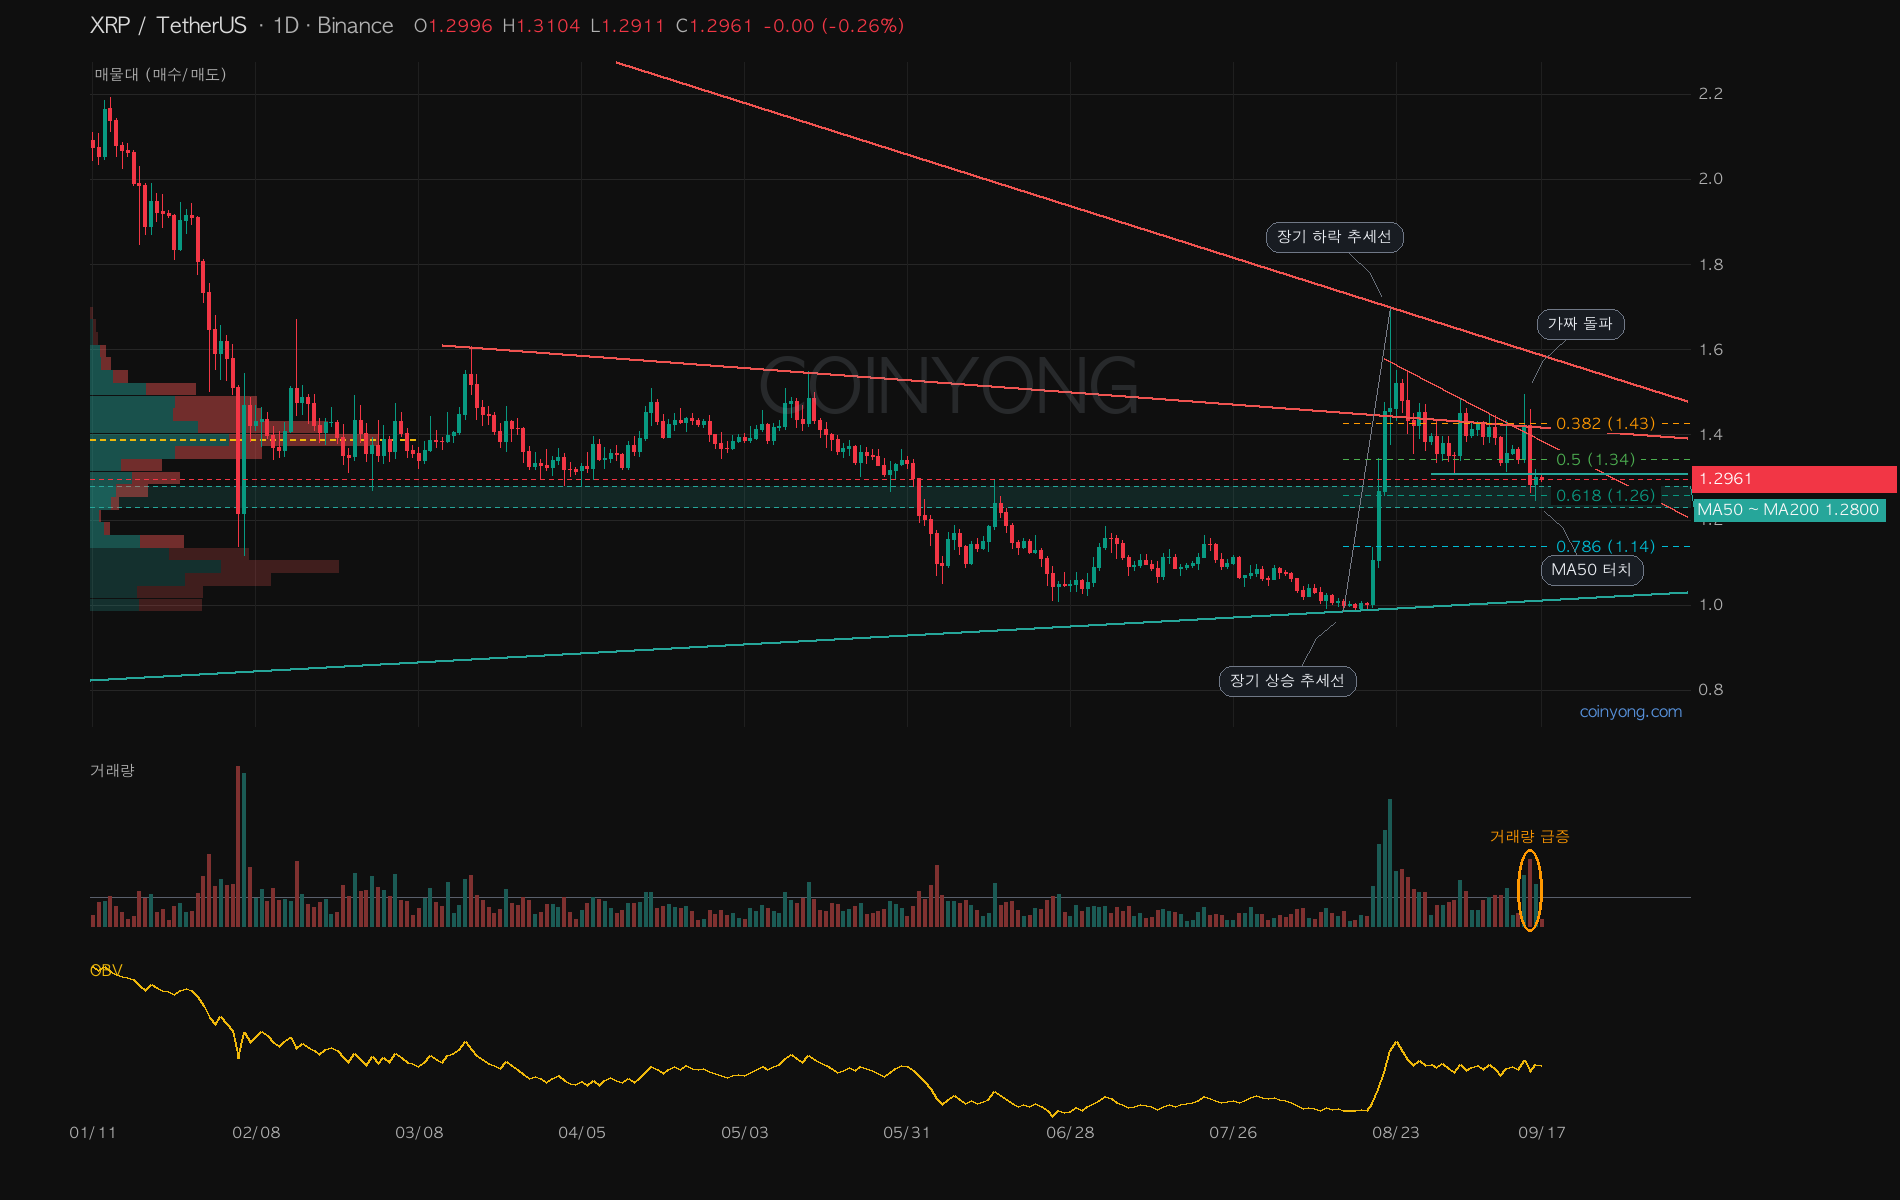
XRP has been stuck around 1.30 since breaking below 1.31 yesterday. It's once again the No. 1 coin by trading value on Upbit today, yet price isn't going anywhere.
On the daily chart above, the key area to watch today is the 1.23–1.28 zone below. The daily MA50, MA200, and weekly MA20 are all clustered there, and yesterday's low of 1.2468 found support right on top of it. Overhead, 1.34 and then 1.37–1.40, where the volume profile is thickest, act as resistance. In the bigger picture, it's still between the weekly downtrend line and uptrend line, so the direction isn't settled.
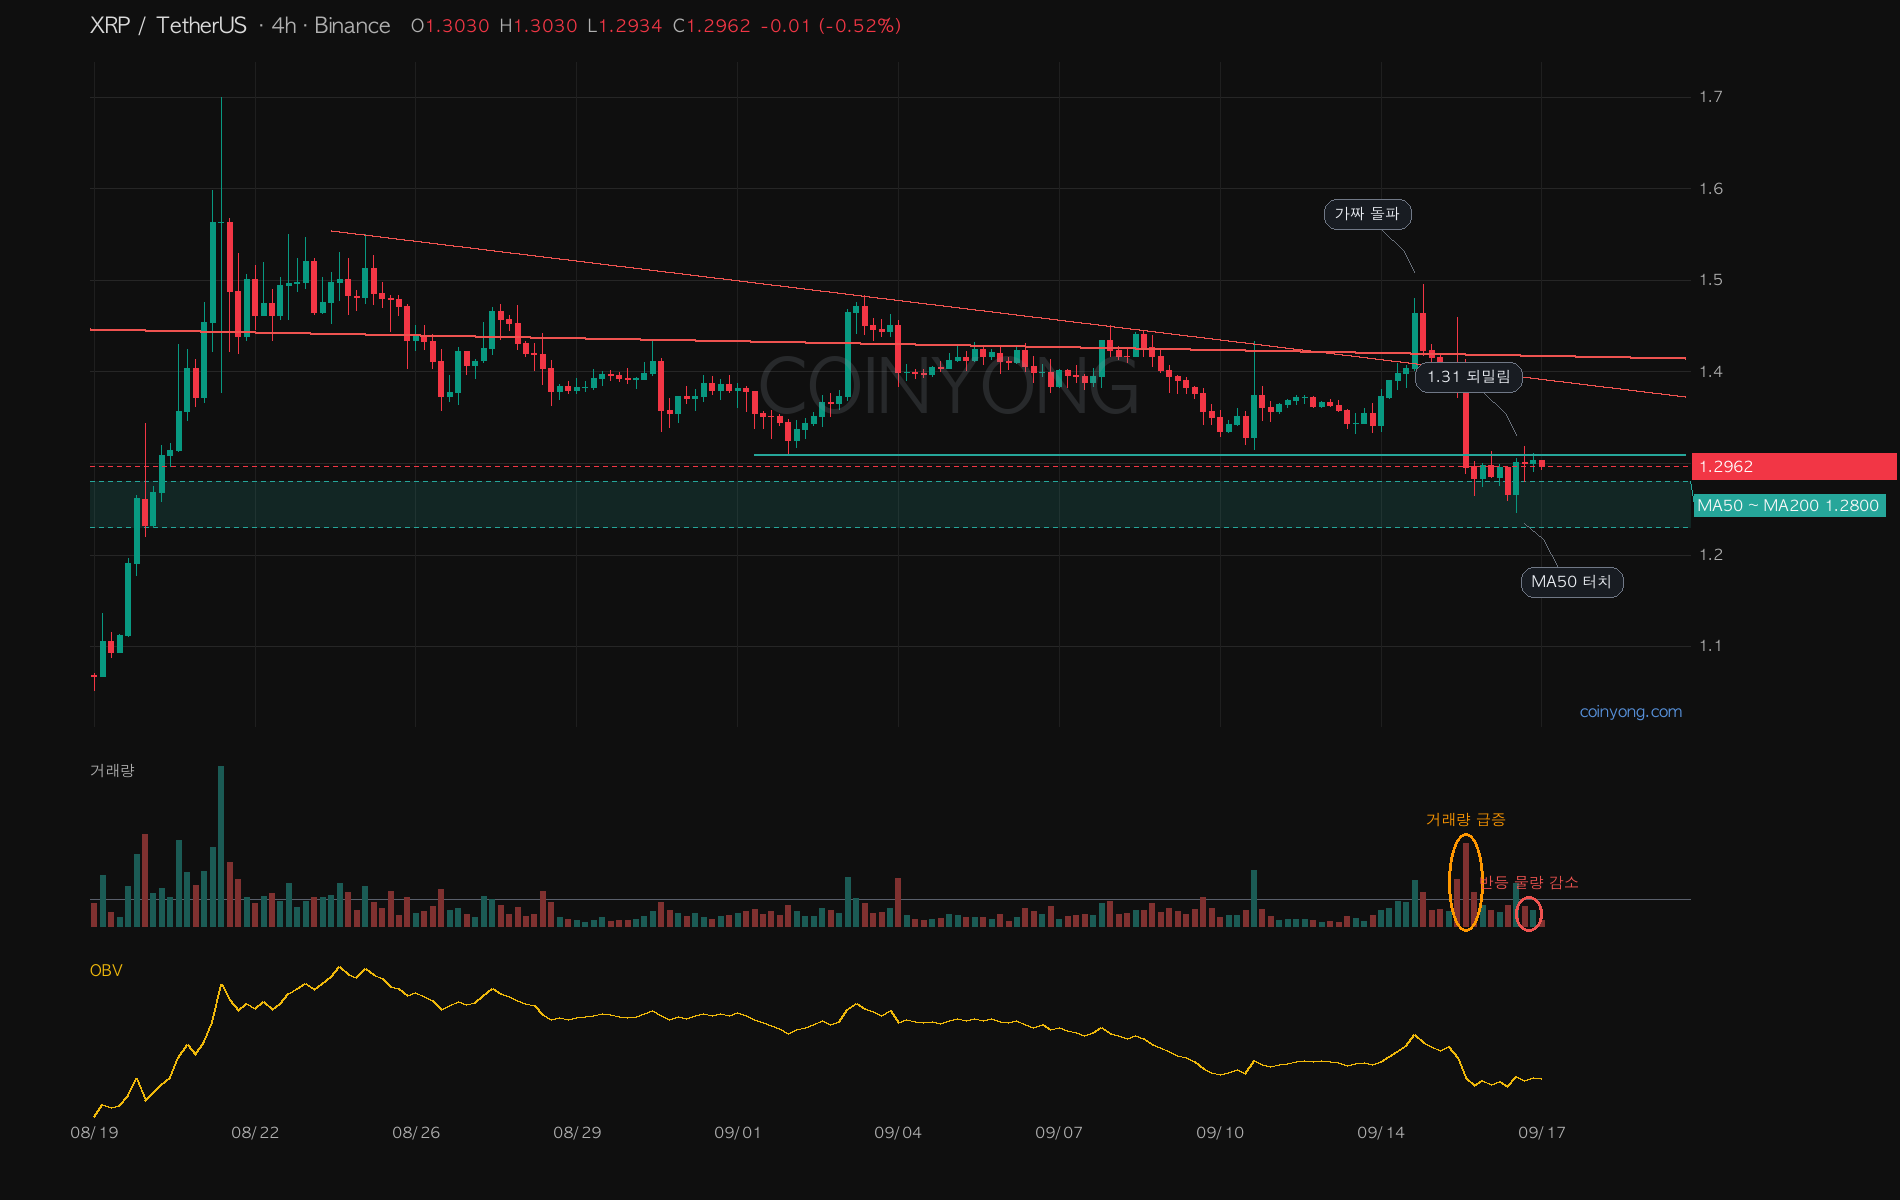
The 4-hour shows a triangle. Highs keep getting lower, and 1.31 had held as support several times, but on the 14th it faked a breakout to the upside, got pushed right back, and broke 1.31 the next day. It did bounce after tagging 1.2468 during the overnight rate decision, but that too stalled at 1.31, on half the volume of the prior candle, so it looks weak.
Whale selling is still coming through, so I think it takes one more dip lower before bouncing. Long liquidations are clustered at 1.24–1.27 too, so it could sweep down there. A daily close below 1.23 opens up 1.14, and below that is the long-term uptrend line near 1.0.
Conversely, a daily close above 1.34 invalidates my bearish view. Anyone who got in during August is pretty much underwater right now..
 ETH
ETH BTC
BTC LINK
LINK