BTC Monthly Double Bottom Breakout: Will It Test 89K?
 Coinyong
 BTC
BTC
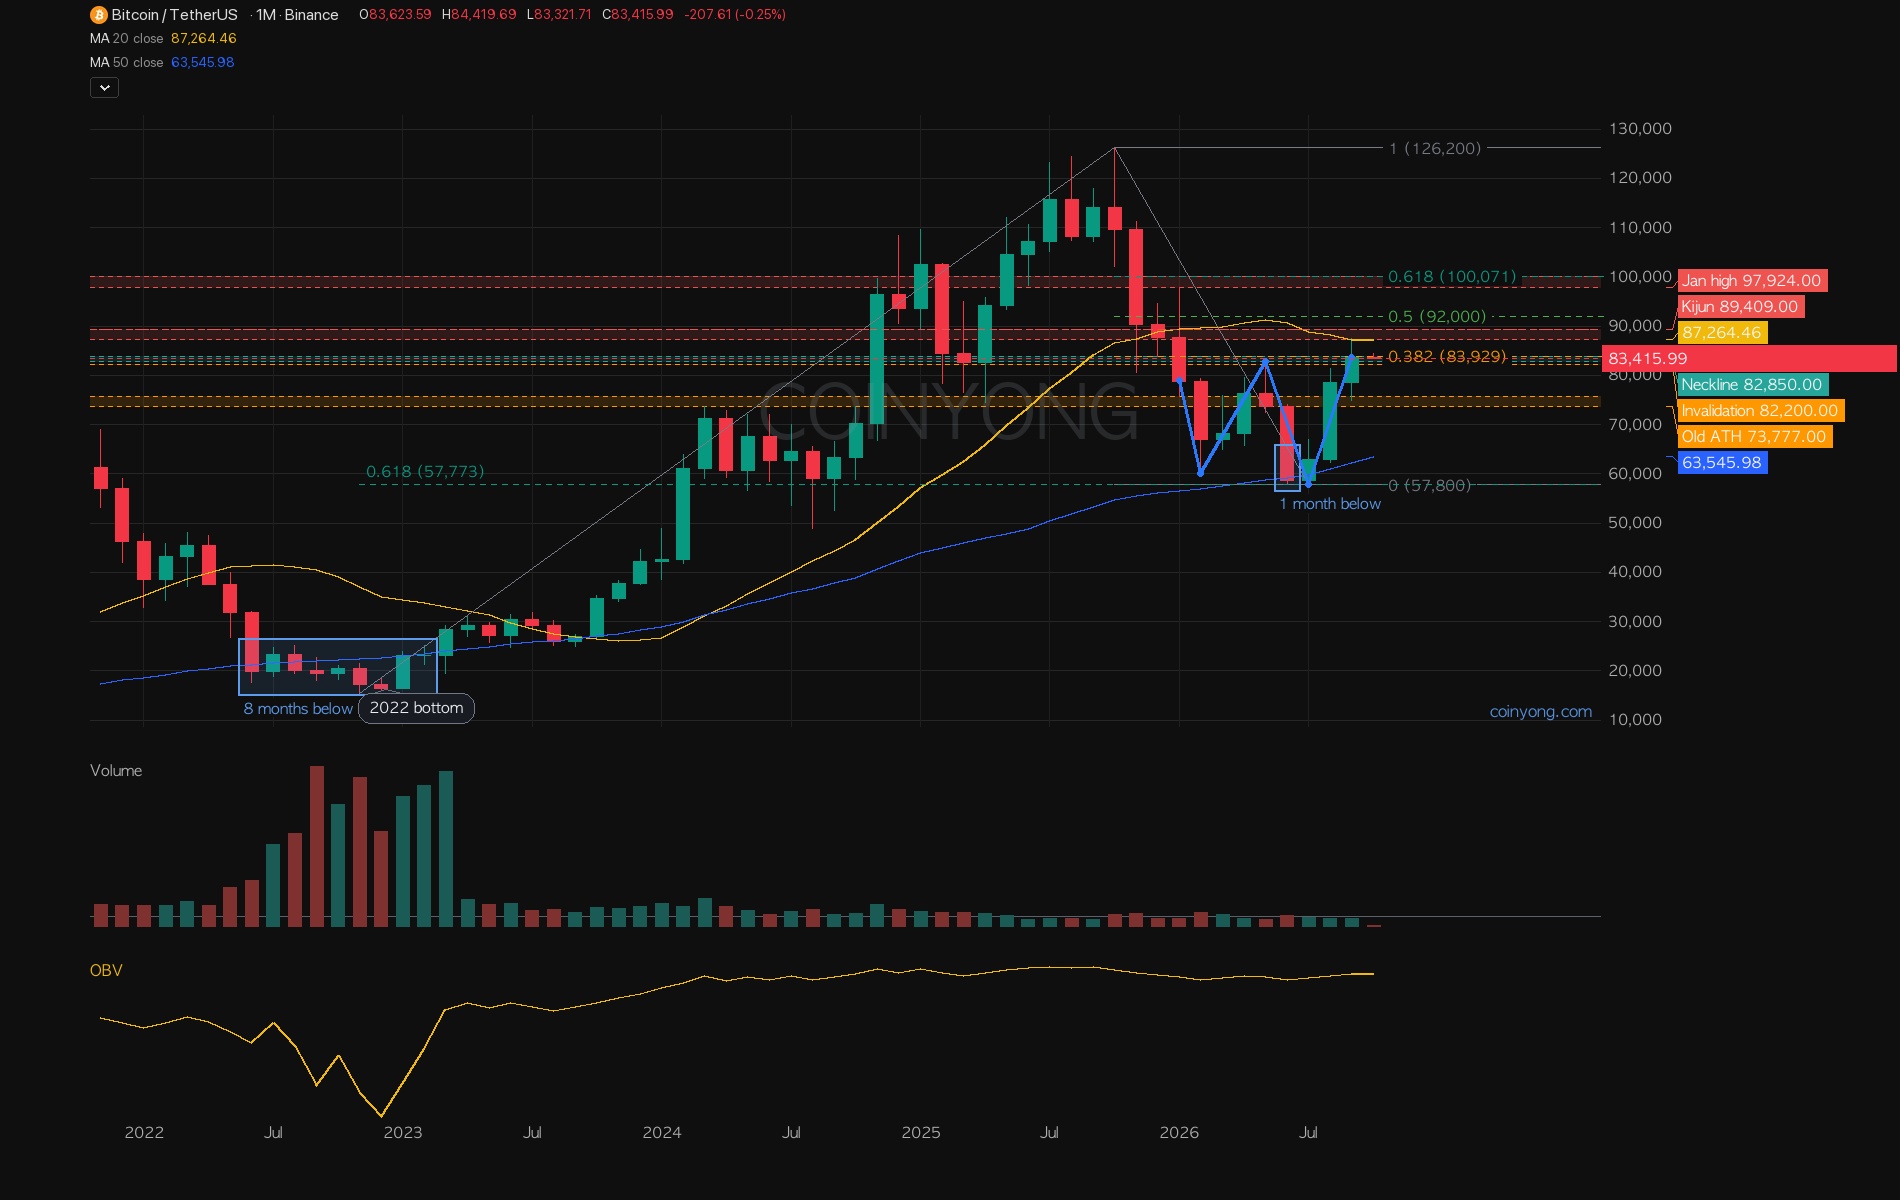
Here's the Bitcoin (BTC) monthly chart. This morning last month's candle and the third quarter closed together, giving three straight green months and a big gain for the quarter. It's also a bullish engulfing that swallowed the entire prior quarterly candle.
On the monthly, it's a double bottom, with lows put in at the start of the year and over the summer. And last month's candle closed above the 82.9K neckline — the high between the two bottoms.
But the margin above it is razor thin. Right overhead at 87–89K, the yellow monthly MA and the Ichimoku base line converge, and last month's upper wick got rejected exactly there. It's too early to call the breakout confirmed.
After a big dip in the middle of last month, price climbed back and even took out the high that formed the neckline. The past week has been chopping sideways in a tight range, and even when US inflation data came out it couldn't break higher and got pushed back.
Down at the lows, the evidence stacks up nicely. Draw a Fib from the 2022 bottom to last year's high and the summer low lands right on 0.618. It's also a good sign that it dipped below the blue MA for just one month before coming right back. In 2022 it wandered below that line for eight months before finally climbing back — compare the two boxed sections on the chart and the difference is obvious.
In terms of size alone, this bounce looks similar to the bear-market rallies of 2018 and 2022. The difference is that back then, bounces off fresh lows couldn't clear the previous rally high, whereas this time it did. In the chart below, the red lines mark rally highs that didn't get taken out and the blue lines mark ones that did. In the past, the blue-line neckline breaks only came after the real bottom was in.
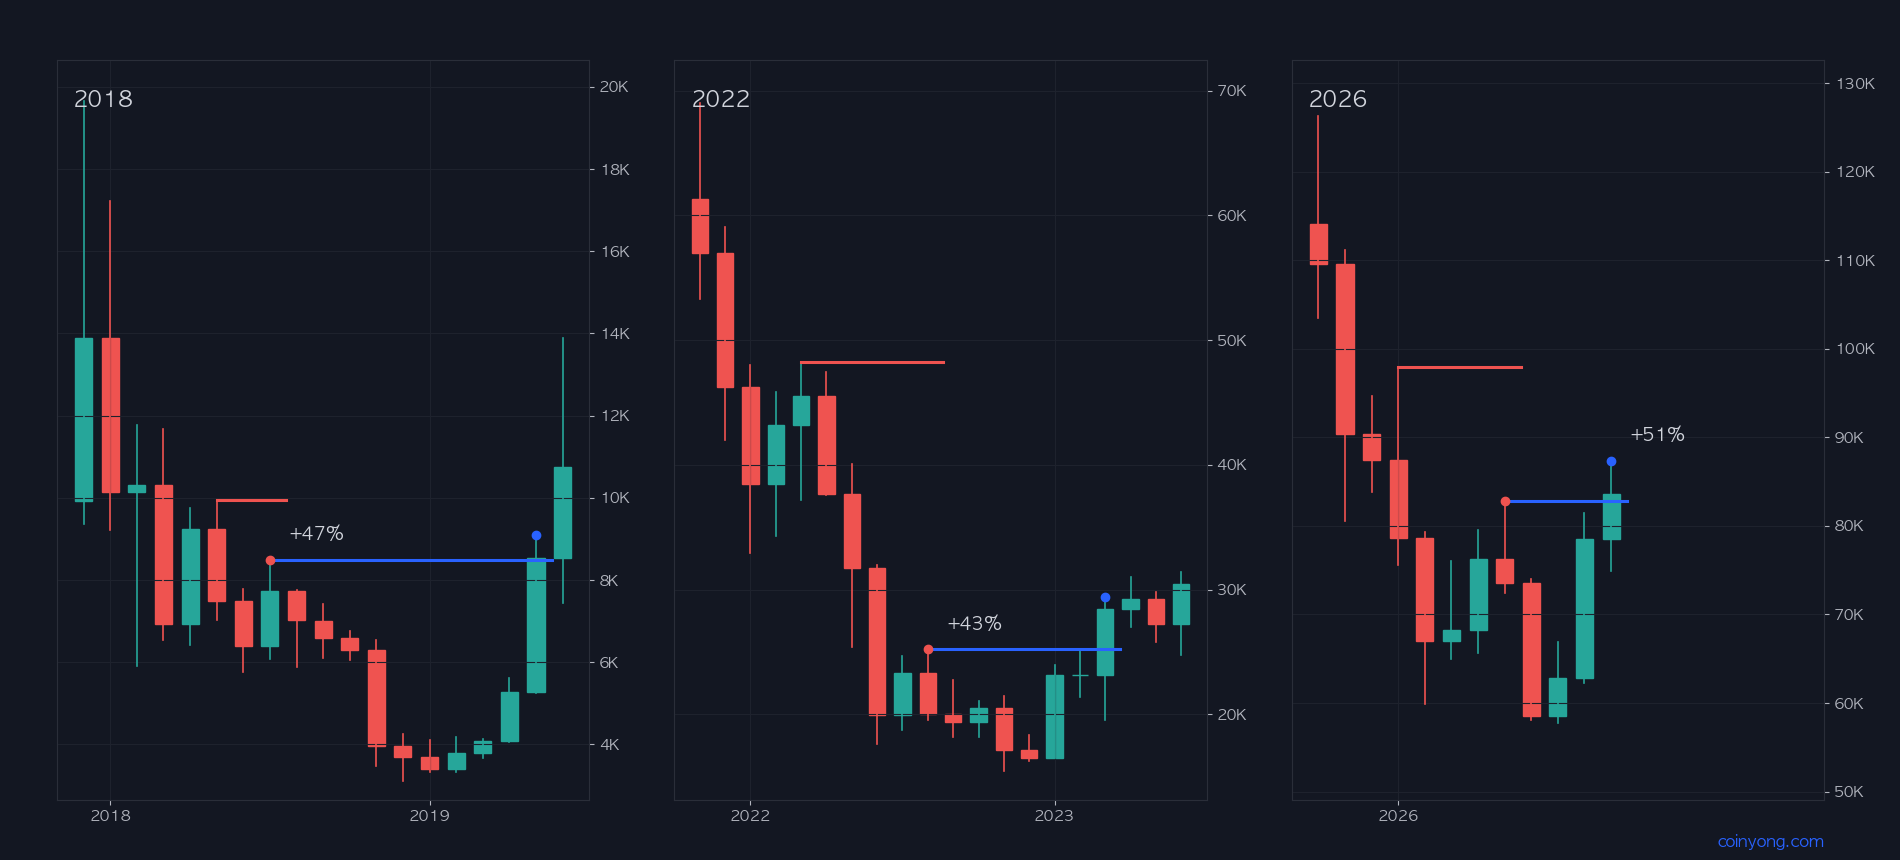
What bothers me is the length of the basing period. Past bottoms came roughly a year after the top, which is exactly the window from now through year-end. That's why quite a few people think this bounce is also a bear-market rally, with one more bottom still to come before the year is out.
The 82.2K level I used as the reference in last weekend's market update held again this time.
This month, even if it consolidates around the neckline first, I lean toward another run at the 87–89K resistance band. A monthly close above it brings the 50% retracement of the decline first, then the zone where the start-of-year high and $100K overlap.
Conversely, a daily close below 82.2K invalidates this view, in which case it could slide back toward last month's low. Deeper still, a monthly close below 73.8K invalidates the bullish thesis altogether — at that point we'd have to admit the earlier pattern was right.
US jobs data comes out tomorrow night, so I'll be watching whether this week's candle closes above the neckline.
 ETH
ETH LINK
LINK XRP
XRP