ETH Reclaims the Monthly 20 MA: Can It Break 2.8K?
 Coinyong
 ETH
ETH
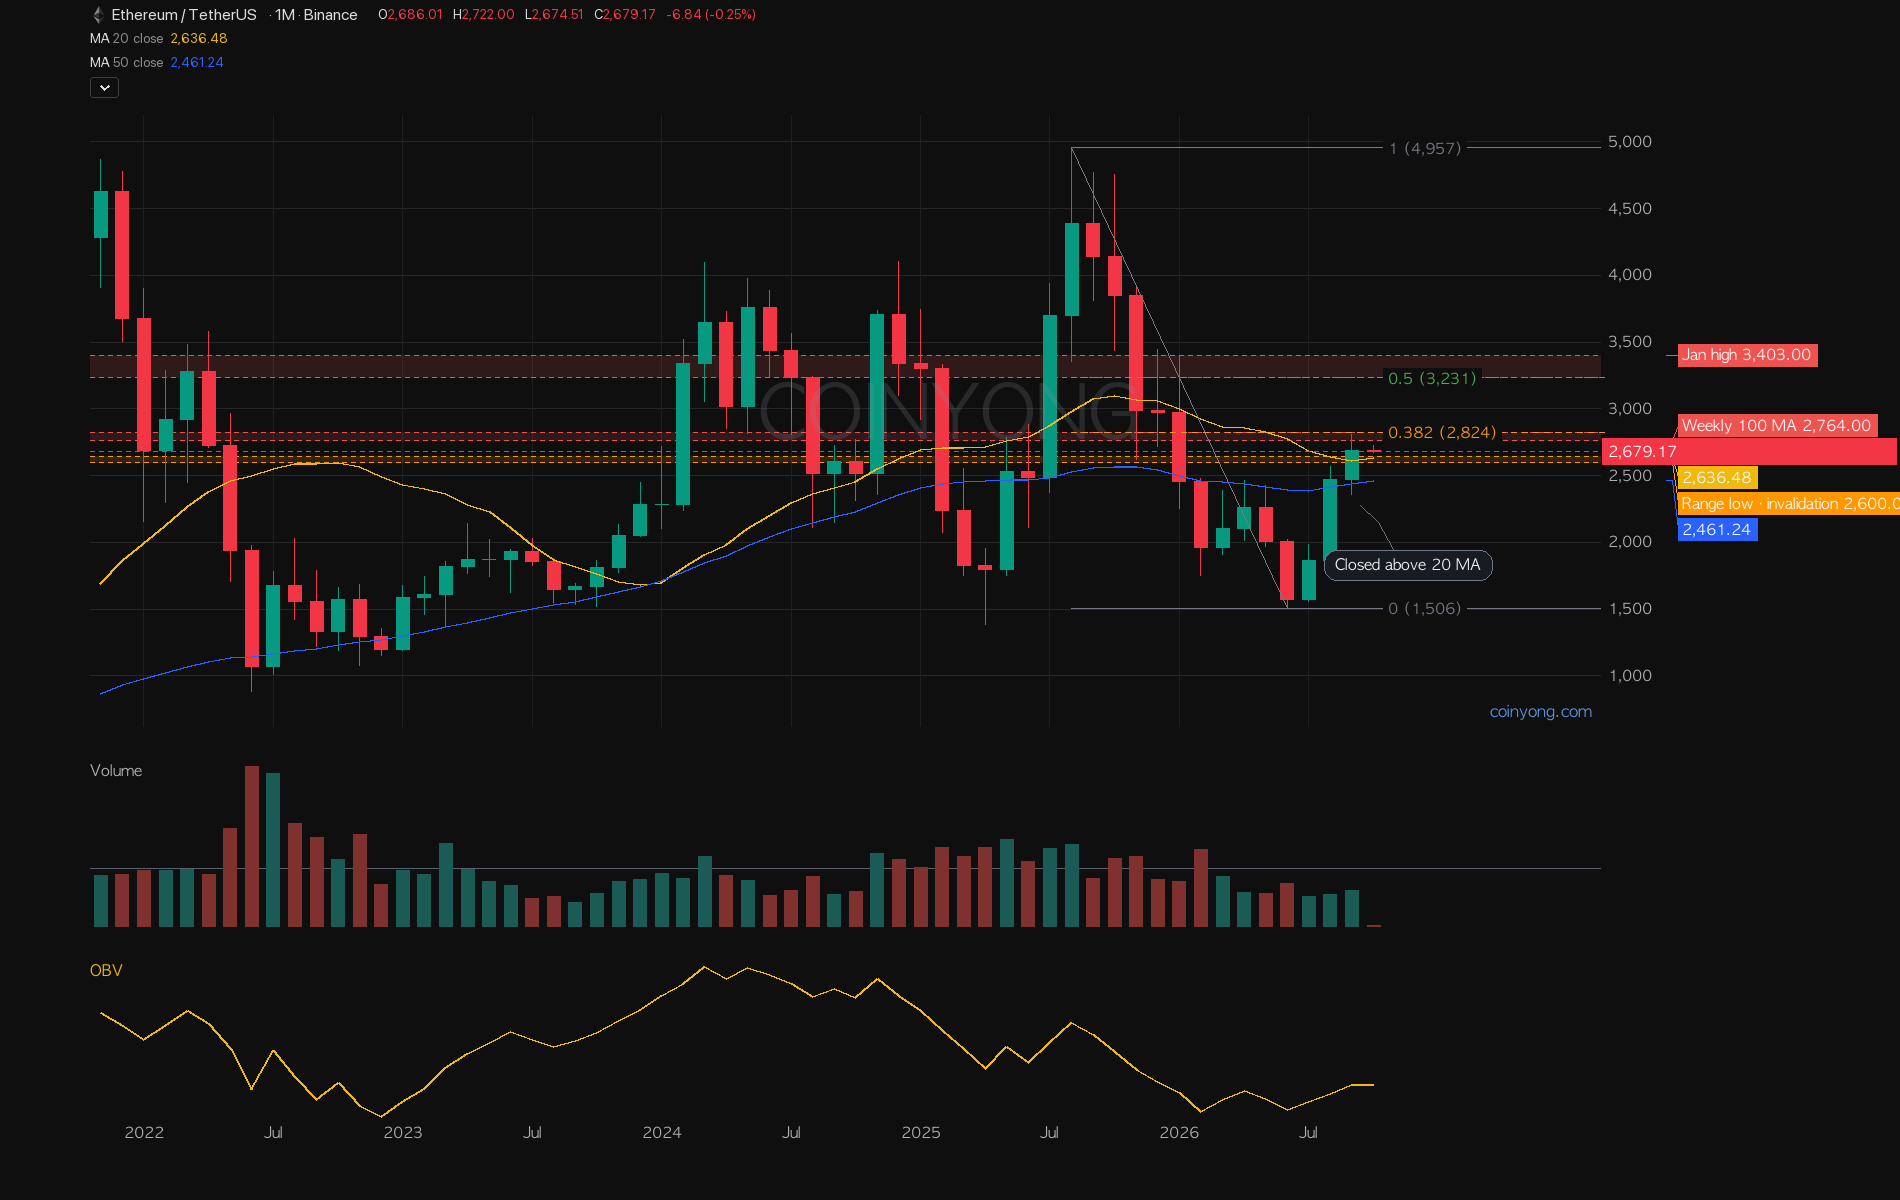
Here's the Ethereum (ETH) monthly chart. The September candle closed above the yellow 20 MA, for the first time in nearly a year. BTC hasn't cleared this line yet, but ETH got there first. Round of applause~!
The problem is the red box right above. It's where the weekly 100 MA and the Fib 0.382 overlap, and last month it only wicked into it before getting pushed back.
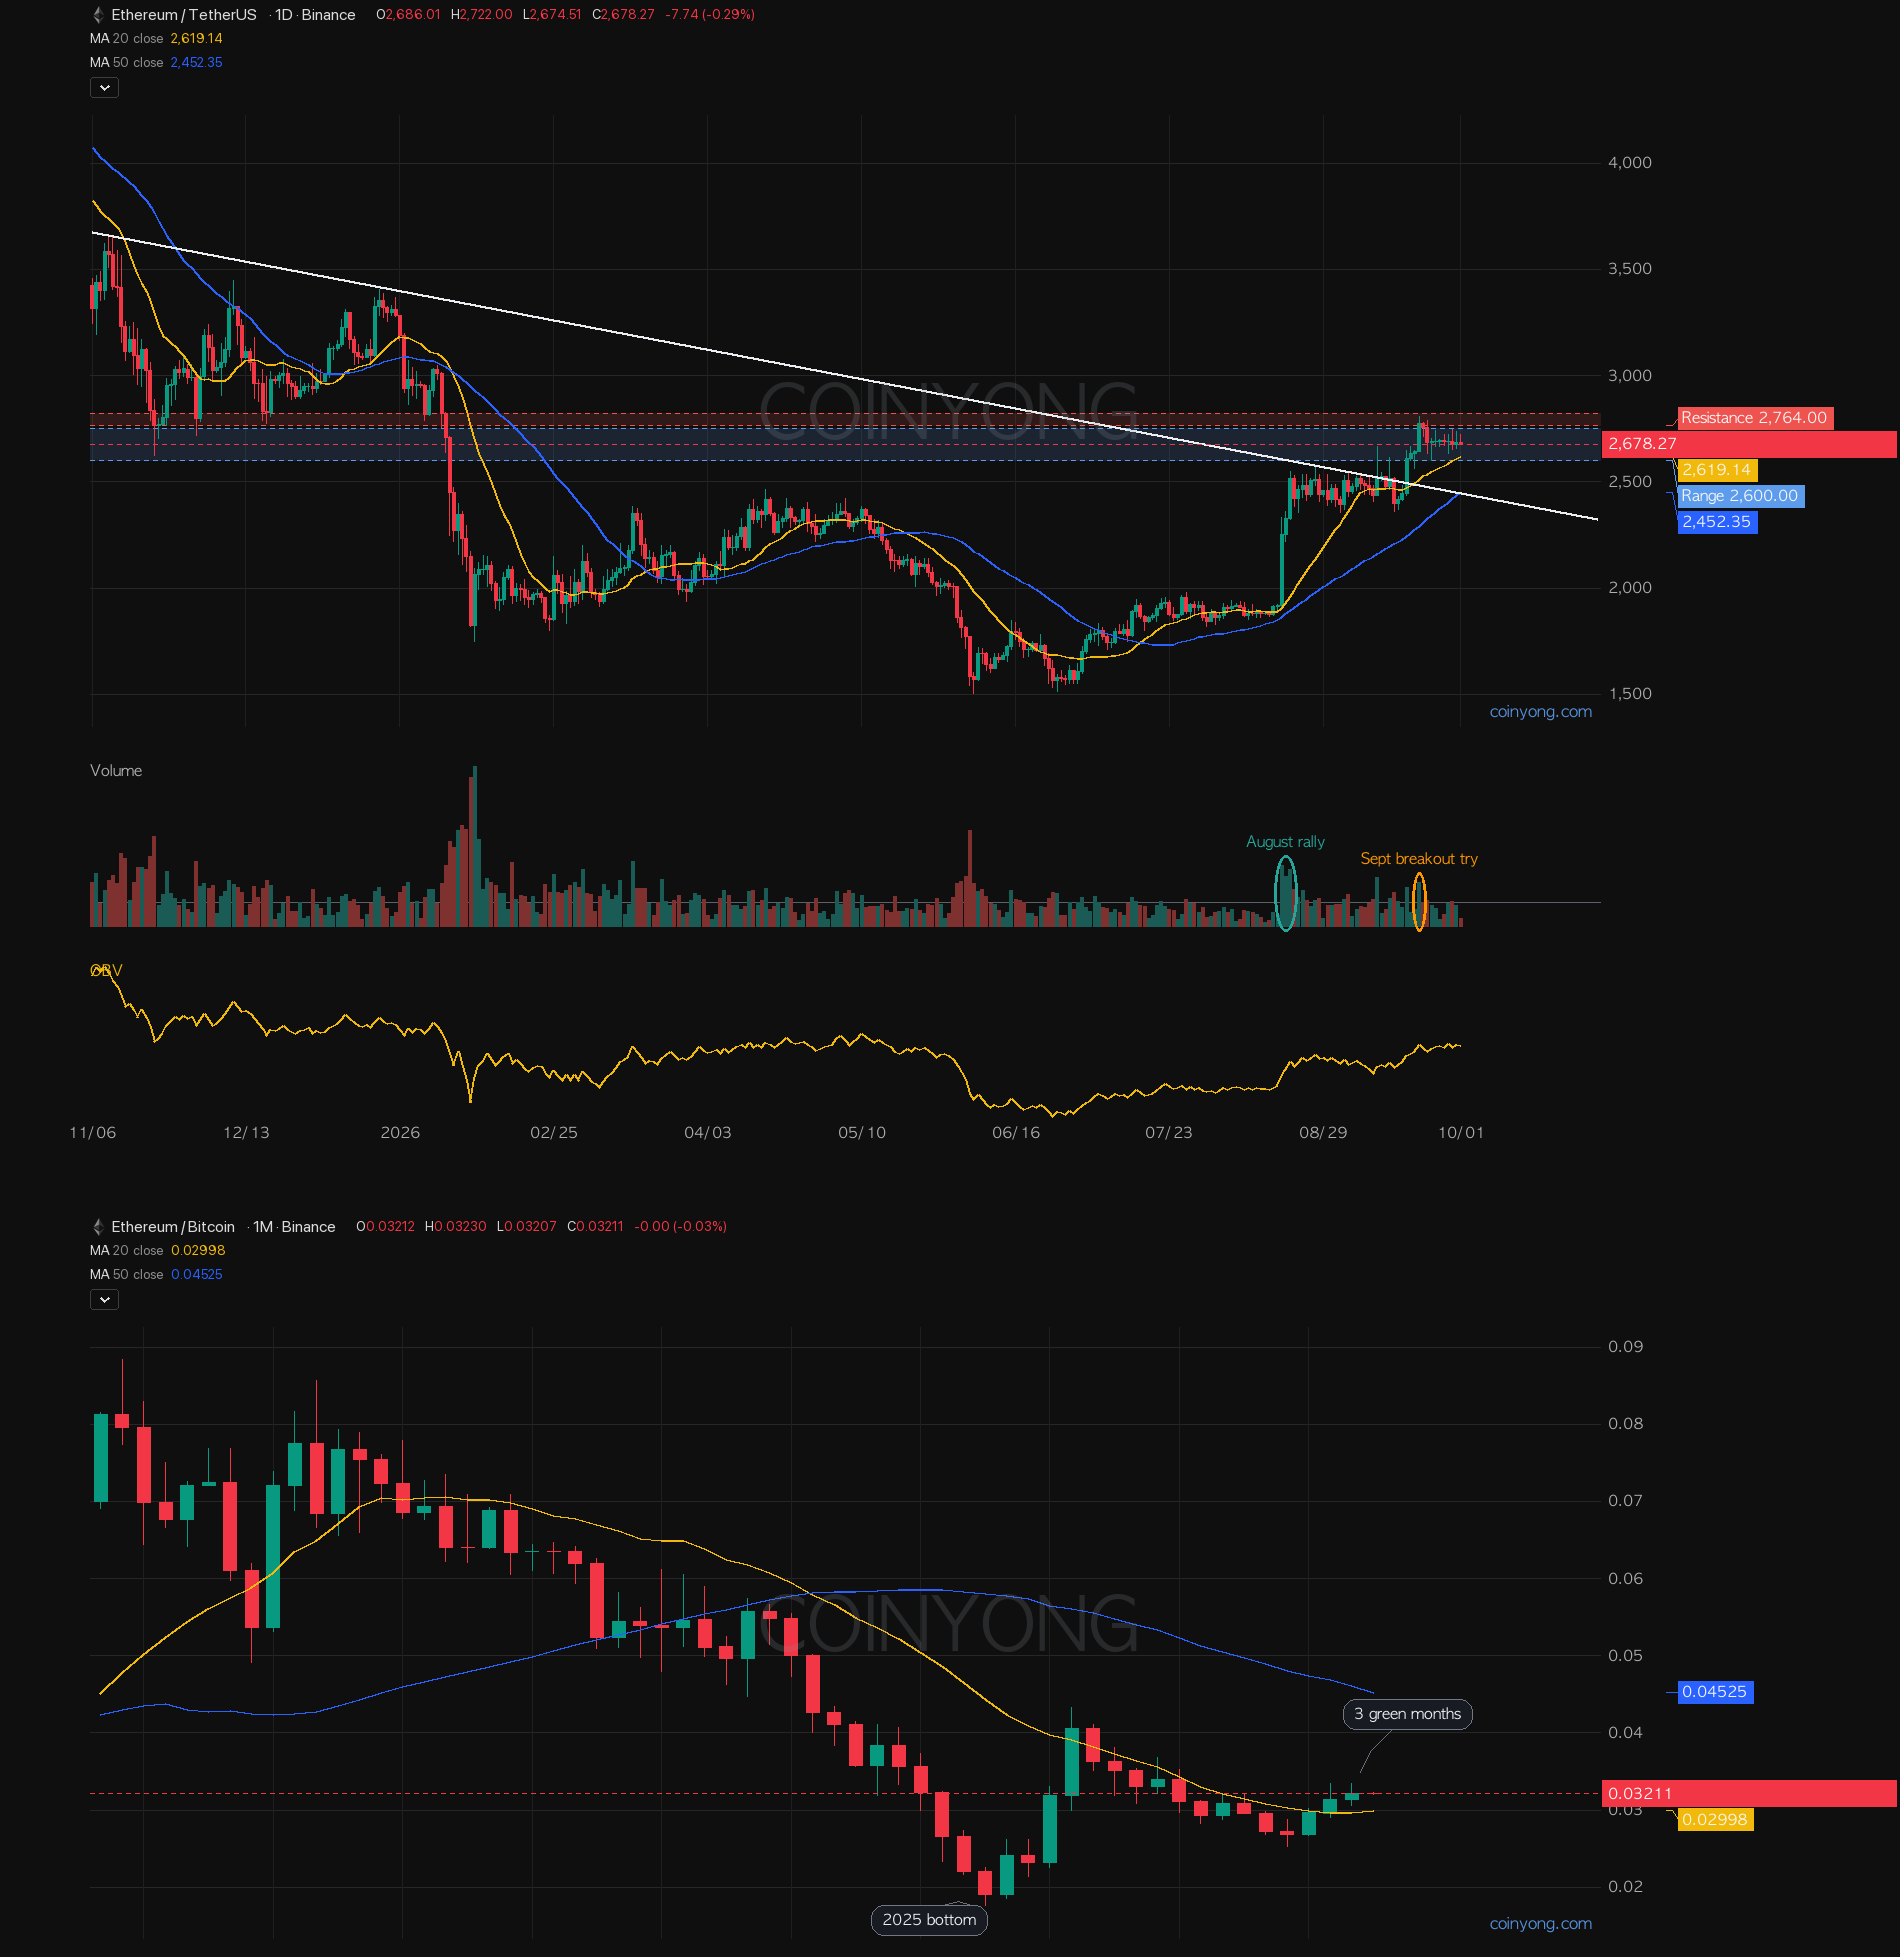
The white downtrend line that had been pressing down since last November was broken in the middle of last month. As the daily above shows, it has been moving sideways inside the blue box for ten days since then.
The disappointing part is volume. Compared with the green circle during the sharp rally, volume dropped off sharply at the orange circle when it tried to break out this time. To break the red box, volume needs to come back in.
ETH/BTC is looking good too. As in the bottom chart, three straight green monthly candles have lifted it above the yellow 20 MA, and ETH dominance has climbed from the 9% range in the summer to the mid-11% range. Money has rotated a bit more toward ETH.
That said, sentiment is a bit frothy. The Fear & Greed Index sat in Greed for almost all of last month. In a setup like this, if it hits resistance and gets pushed back once more, disappointment-driven selling can easily follow.
Still, this month I'm leaning toward it holding the bottom of the blue box and breaking up through the red box. If it does, the Fibonacci 0.5 line on the monthly comes first, followed by the January high.
Conversely, if the daily closes below the box bottom at 2.6K, that also breaks the yellow MA, so this scenario is invalidated. If the monthly closes back below the blue 50 MA, it's time to fold the bullish view altogether.
Whether ETH pulling ahead of BTC is a signal of money rotating into alts will ultimately be decided by whether it clears the red box.
 BTC
BTC LINK
LINK XRP
XRP