Chainlink's Upper Wick: Pullback to 13.3 Ahead?
 Coinyong
 LINK
LINK
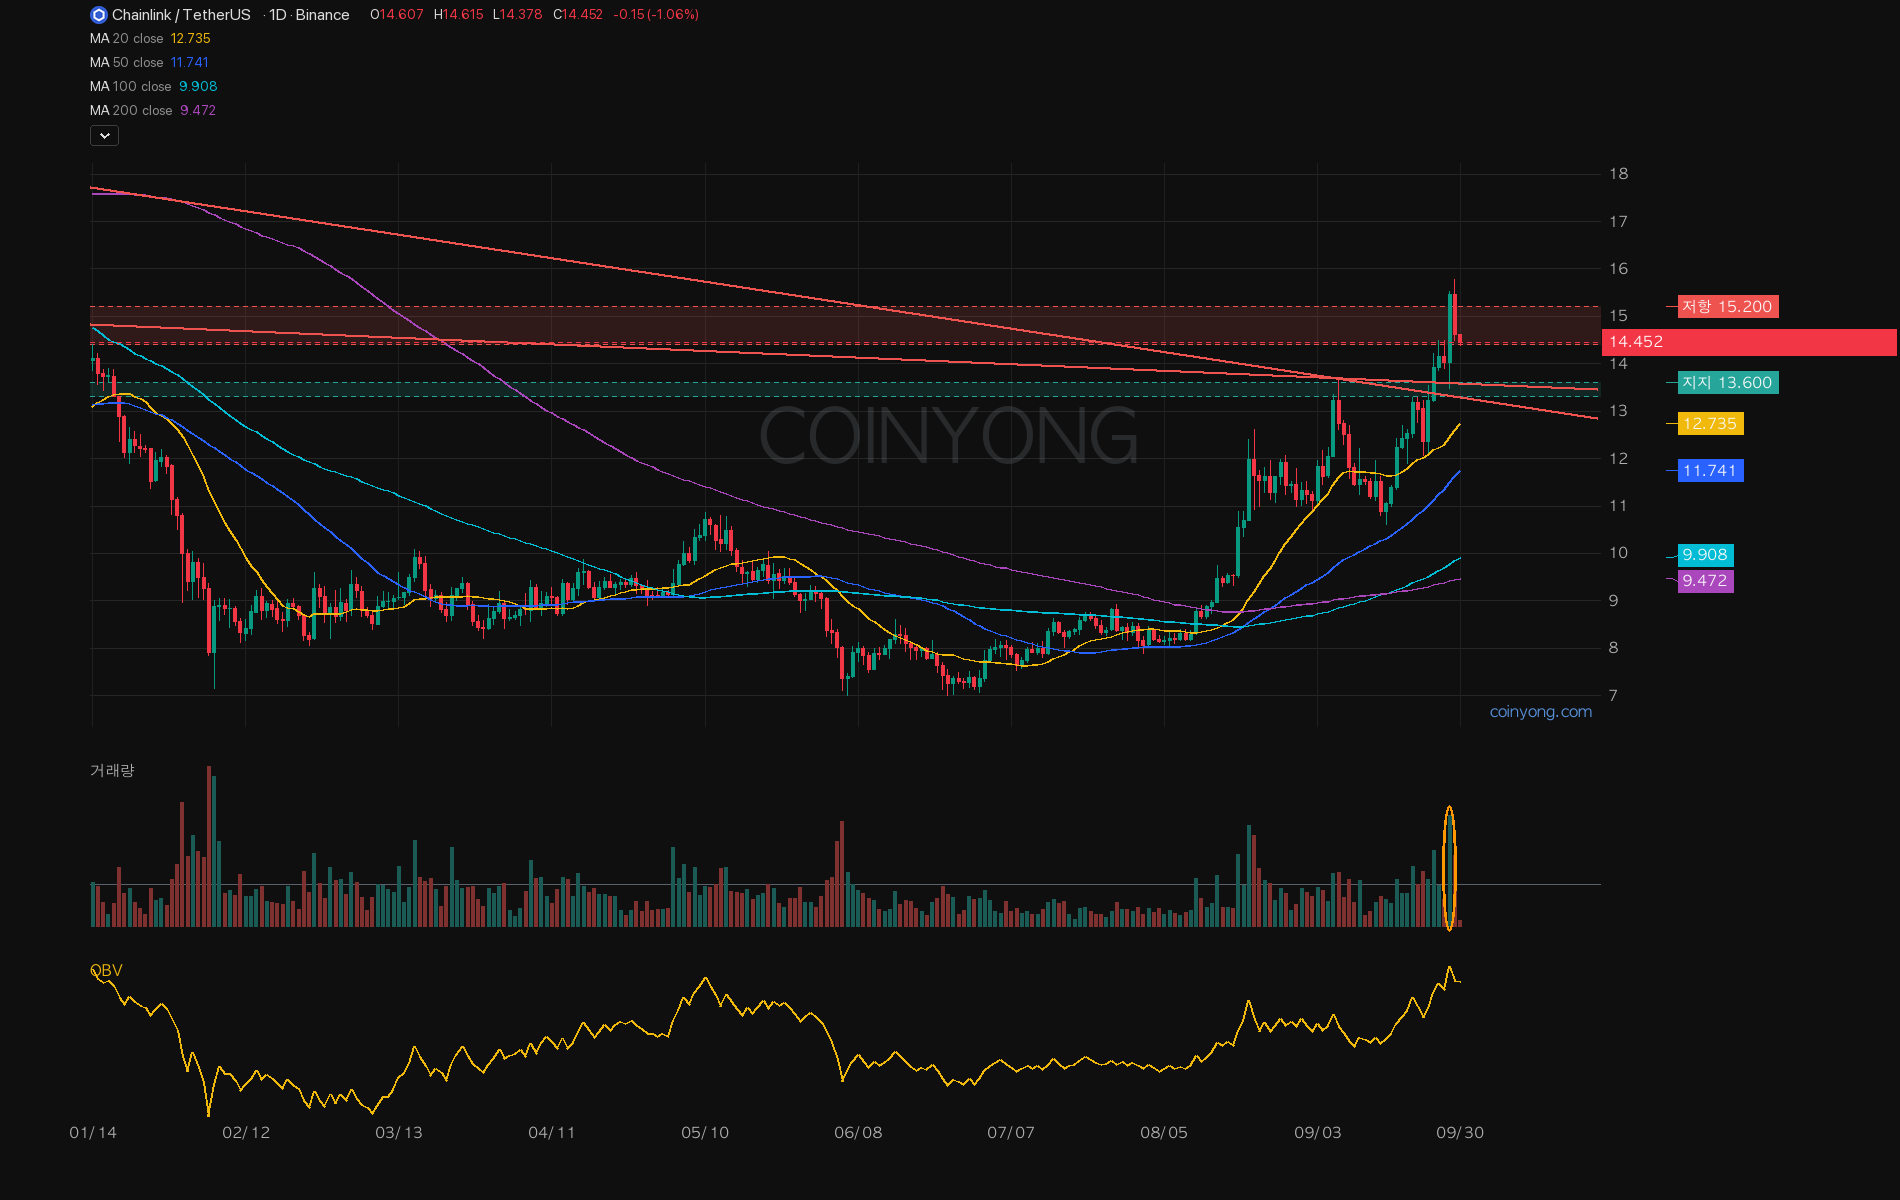
Here's the Chainlink (LINK) daily chart. It surged on Monday and broke through the resistance zone above, but yesterday it ran to 15.78, left a long upper wick, and dropped back inside the resistance zone.
In my last post I was watching whether the weekly would close above 14.5, and last week's candle closed below it. So the condition wasn't met. Then came Monday's surge, and on the same day Chainlink officially announced the general availability of CCIP 2.0 and a connection to the Swift ledger at Sibos. In other words, it was a breakout backed by both a catalyst and volume.
The issue is the level it ran into. This is the resistance zone where the weekly highs from late last year and early this year cluster, and the long-term weekly MA and the retracement of the big upswing all overlap inside it. Last winter, too, the weekly got rejected here several times before dropping hard. Since it cleared the top of the zone in a single day and then fell back inside, this first attempt should be read as rejected.
Flows are on the sell side up top as well. Futures open interest, which jumped during the surge, has dropped back since the high, and splitting executions by order size, mid-sized orders were net sellers all day. Yet the top-trader long share actually increased. When longs pile up while price is slipping, it's easy for price to tag the long-liquidation cluster just below, starting around 14.2.
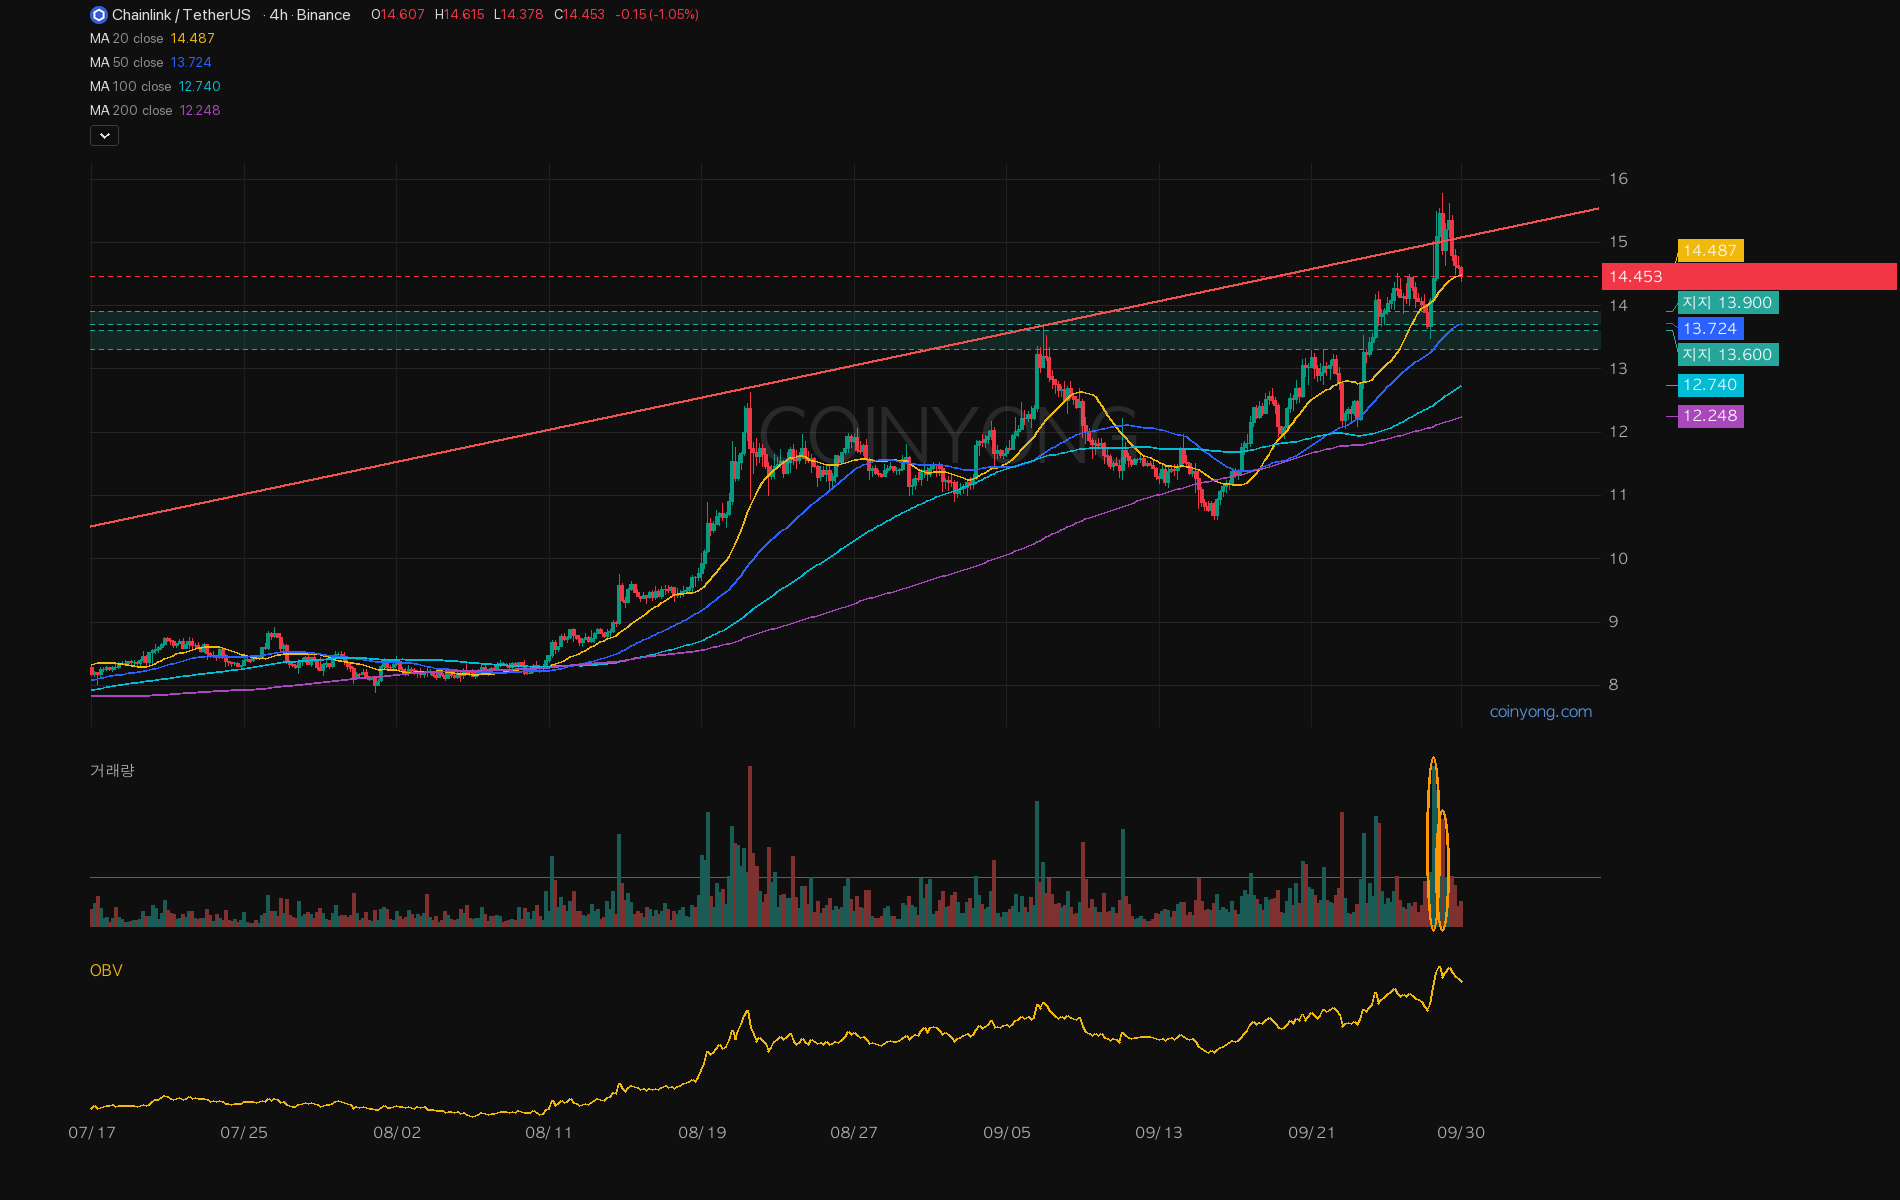
The pullback is clearer on the lower timeframe. As the chart above shows, price pushed above the rising resistance line connecting highs since summer on Monday night, then fell back below it yesterday. Since then, highs and lows have been edging lower, and it lost the short-term moving average this morning. If it keeps slipping, the first stop is where last weekend's low and the MA that has supported the short-term trend overlap.
- Key resistance 14.4~15.2
- First support 13.7~13.9
- Key support 13.3~13.6
This week, it's more likely that LINK fails to get back above the resistance zone and slides to key support. That's where the two downtrend lines it broke last week pass through, and it's also where the neckline of the inverse head and shoulders on the lower timeframe and the heaviest volume node of the past two years sit. Of course, the daily trend itself is still strong. All the moving averages are pointing up, so the pullback could end shallow. A daily close above 15.5 invalidates the pullback call and shifts the setup to a breakout above the resistance zone.
If Monday's surge was real, the downtrend line it broke should act as support this time — but how long will the longs hold out on the way down to that line?
 ETH
ETH BTC
BTC XRP
XRP