BTC Broke Above 80K, Then Slid Right Back
 Coinyong
 BTC
BTC
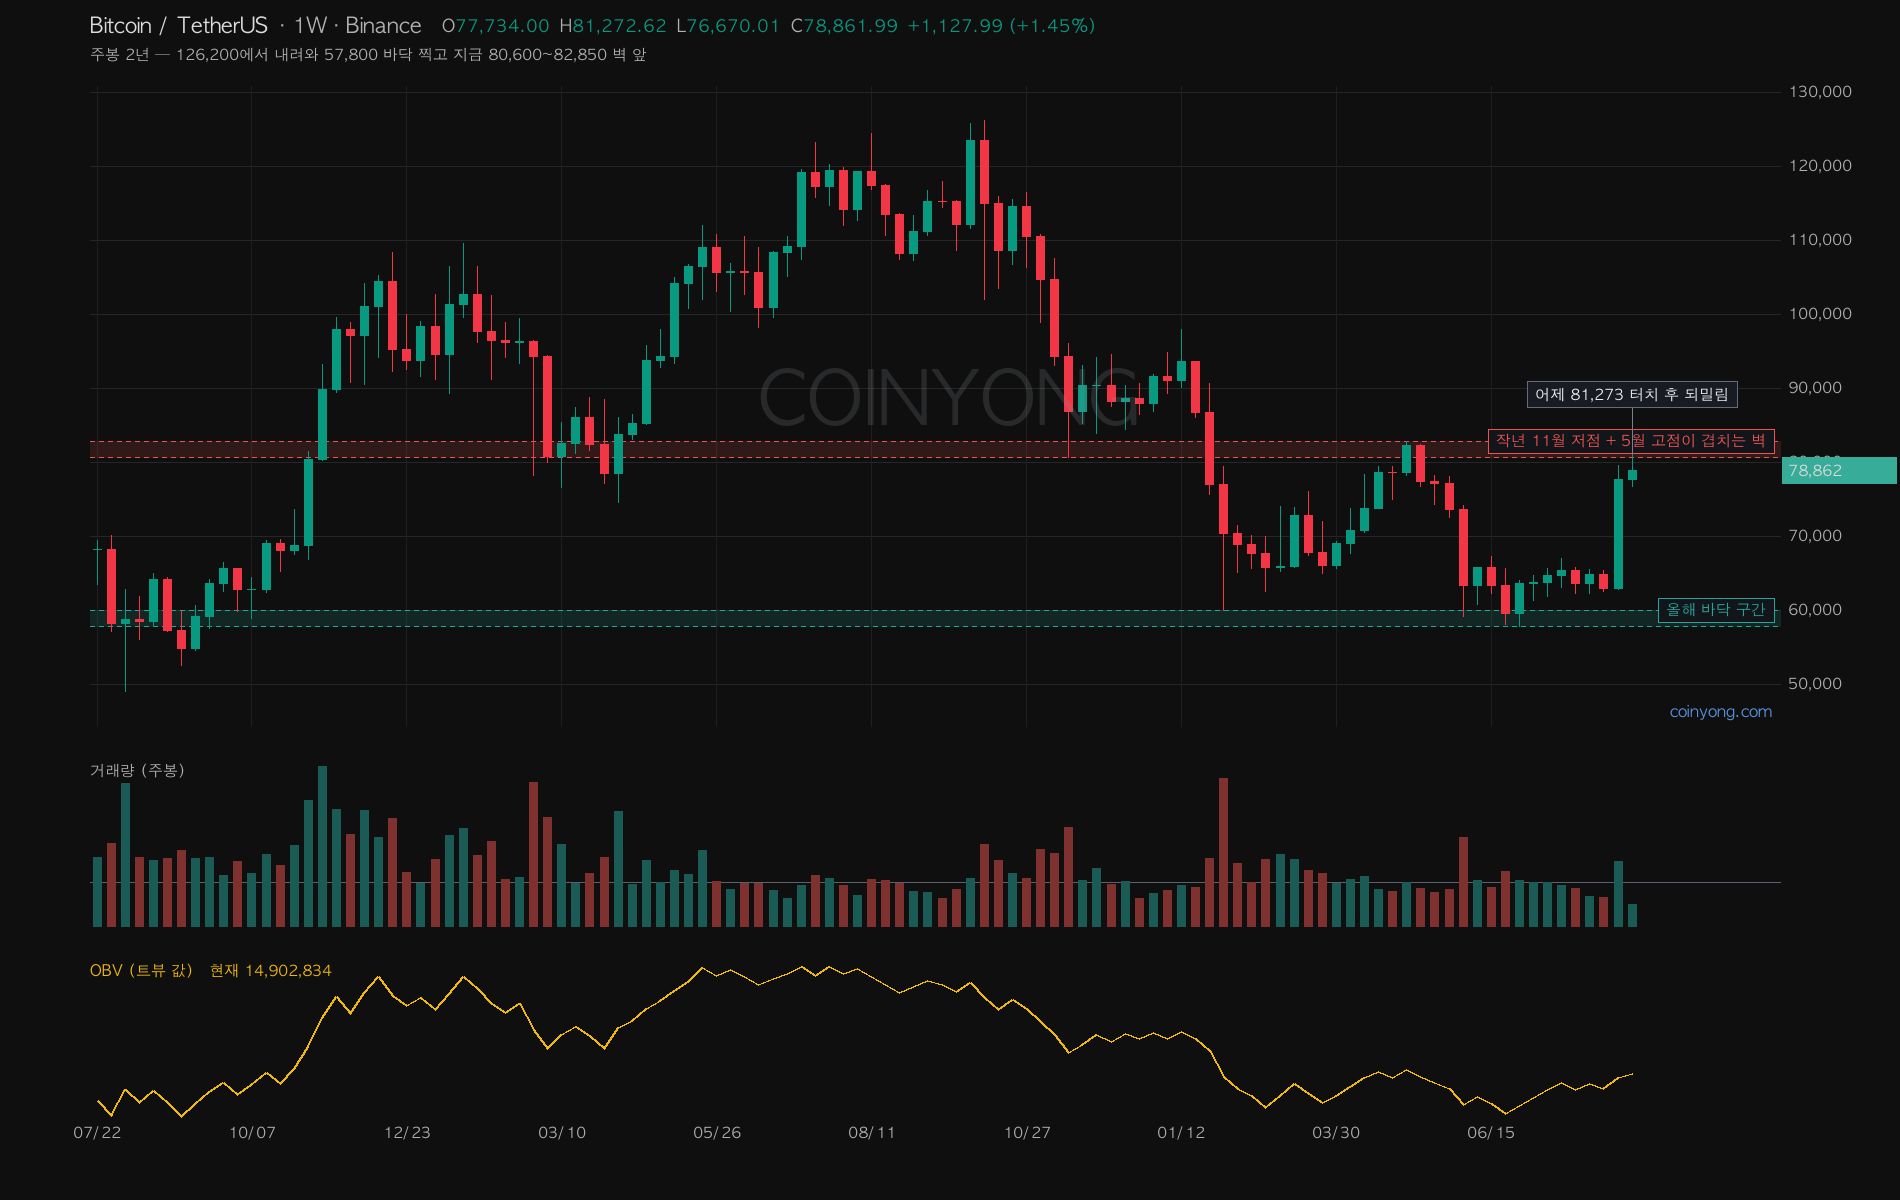
August is down to its last few days. Early yesterday BTC ran up to 81,273 — briefly clearing the level I flagged as overhead resistance in my last post — but it closed at 78,539. Today I want to look at why that level is so heavy, working down from the weekly.
On the weekly, the current position becomes clear. Price started falling from 126,200 last October, found a bottom at 57,800 in early July, and got here in a month and a half. The 80,600–82,850 zone it's stuck in now is where last November's low and this May's high sit together. The weekly MA50 at 81,089 runs right through it too. In other words, this isn't a zone you clear in one go.
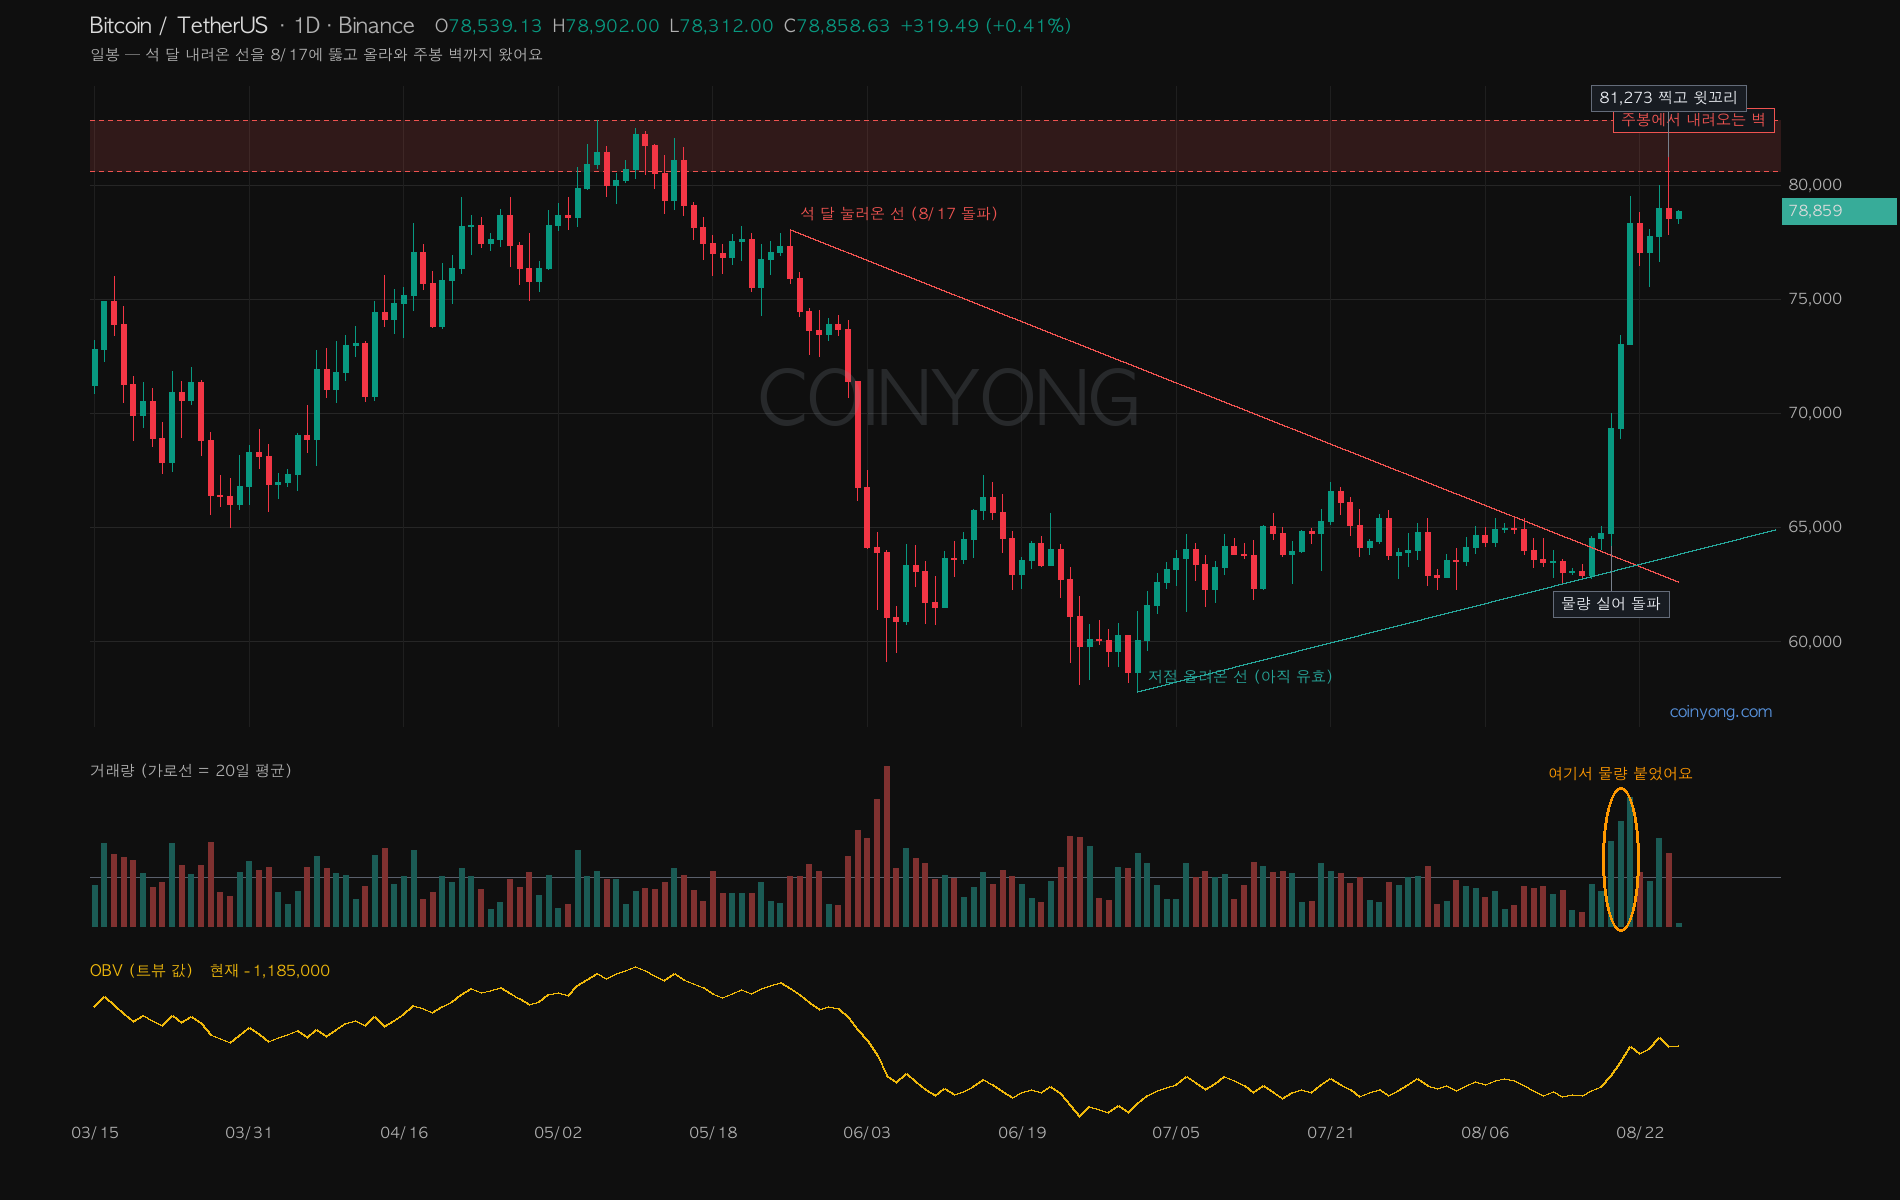
Dropping to the daily shows how it got here. There was a line pressing down for three months from 78,080 in late May to 65,474 in early August, and a separate rising-lows line from 57,800 in early July. The two met in mid-August, and on the 17th price broke out to the upside. Starting the 19th, heavy volume came in for three days and carried it from around 65,000 to 79,500 in one shot. The rising-lows line is still intact and sits near 63,800 today.
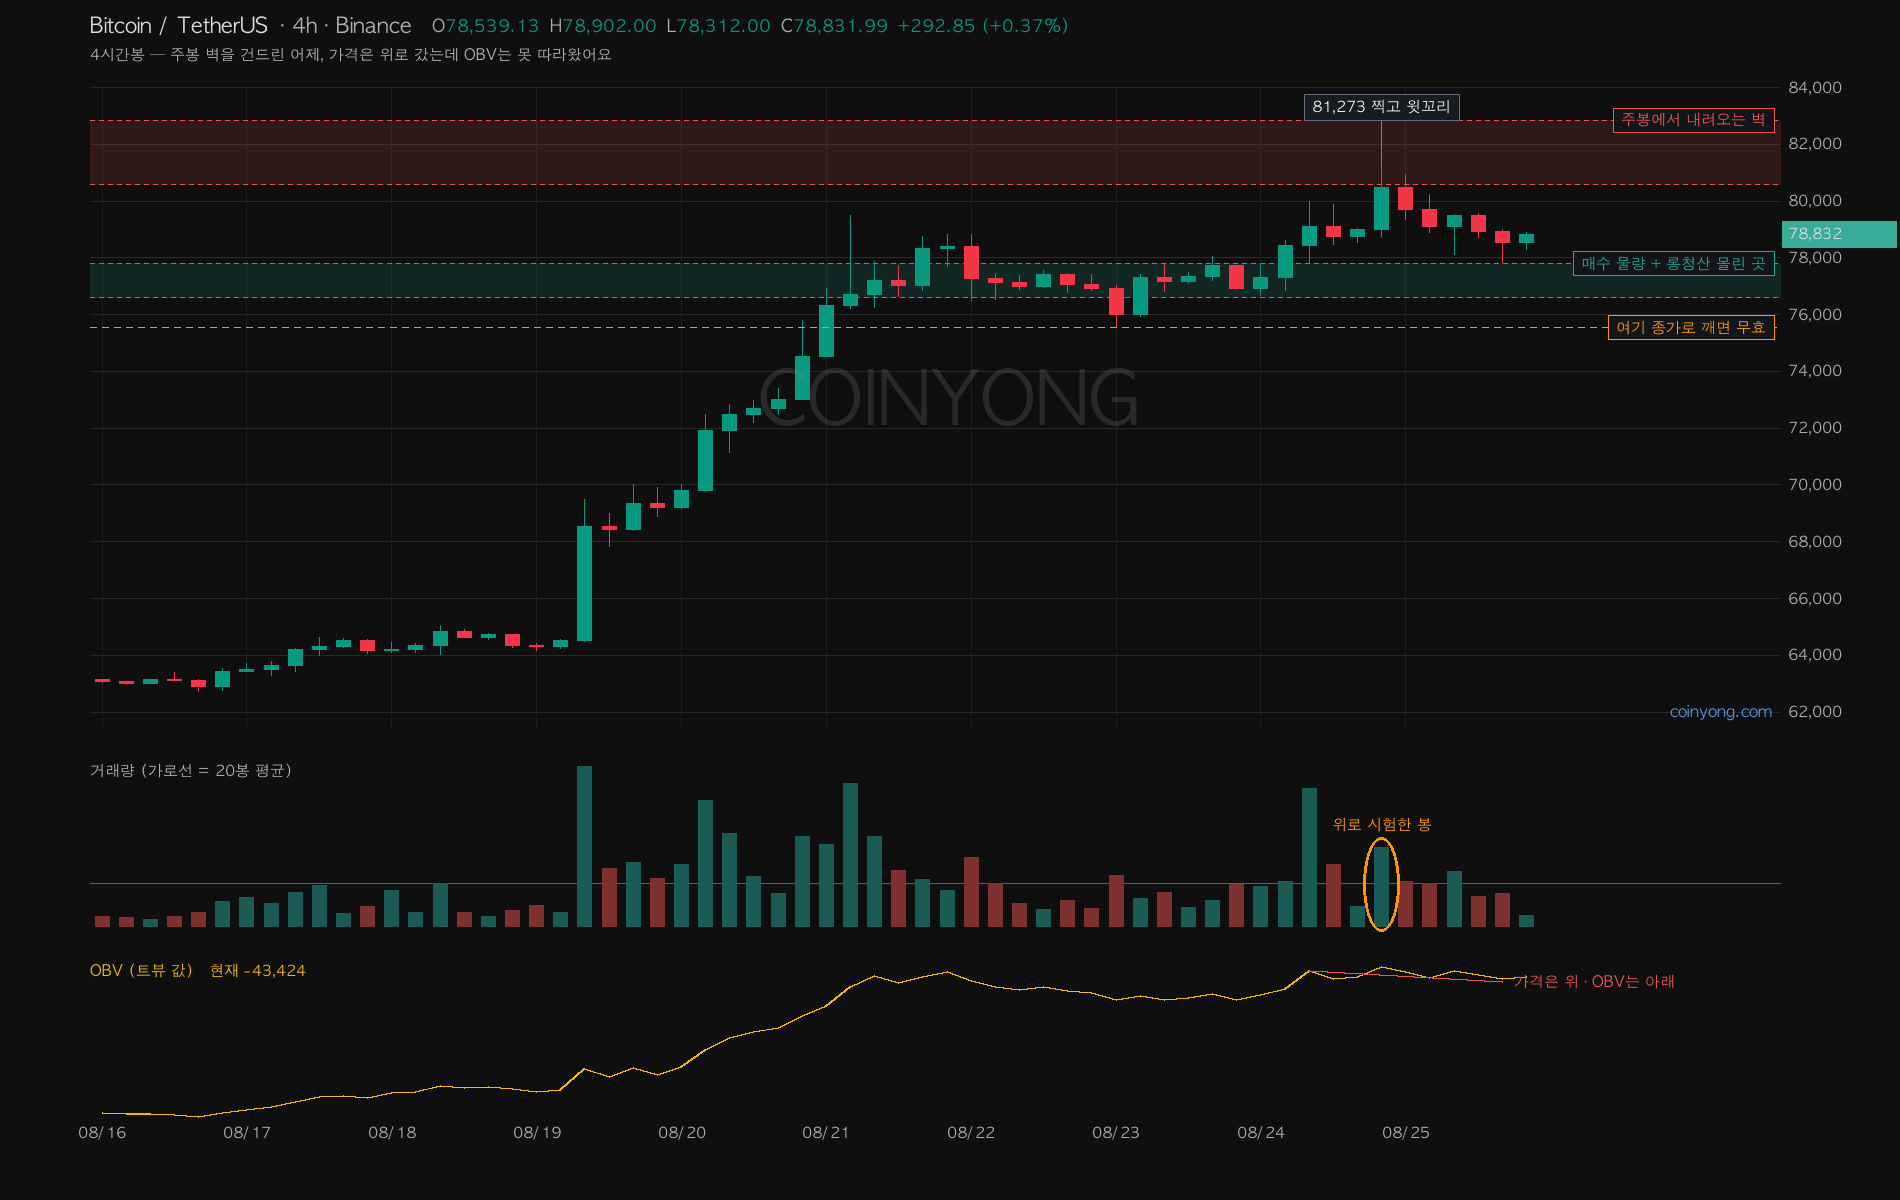
Yesterday needs to be read on the 4-hour. Four candles held above 80K, but OBV peaked on the very first one — the candle that tagged 81,273. Price stayed above 80K after that, yet OBV actually dropped. The buying that pushed price higher wasn't sustained.
Splitting trades by size tells a similar story. Over the past 24 hours, orders above $100K net sold more than $200M, and only mid-sized orders between $1K and $100K were buying. It was a day of coins changing hands from larger traders to smaller ones.
Right now the walls are close on both sides. There's roughly $80M in sell orders at 79,500, and bids at 77,500 are slightly thicker than that. The 76,600–77,800 zone is where price spent the most time over the past four days, so long positions have built up there accordingly. It's support, but also a spot where one slip could set off a chain of liquidations.
I still think the direction is up. But the first thing to confirm is whether it retakes the 81,273 it couldn't hold yesterday — and closes above it this time. A close below 75,546 invalidates this setup. Stretches where big orders sell while price holds up are always a bit frustrating. This doesn't look like a place to rush in before direction is clear.
 ETH
ETH LINK
LINK