Bitcoin: Cup and Handle or Inverse Head and Shoulders?
 Coinyong
 BTC
BTC
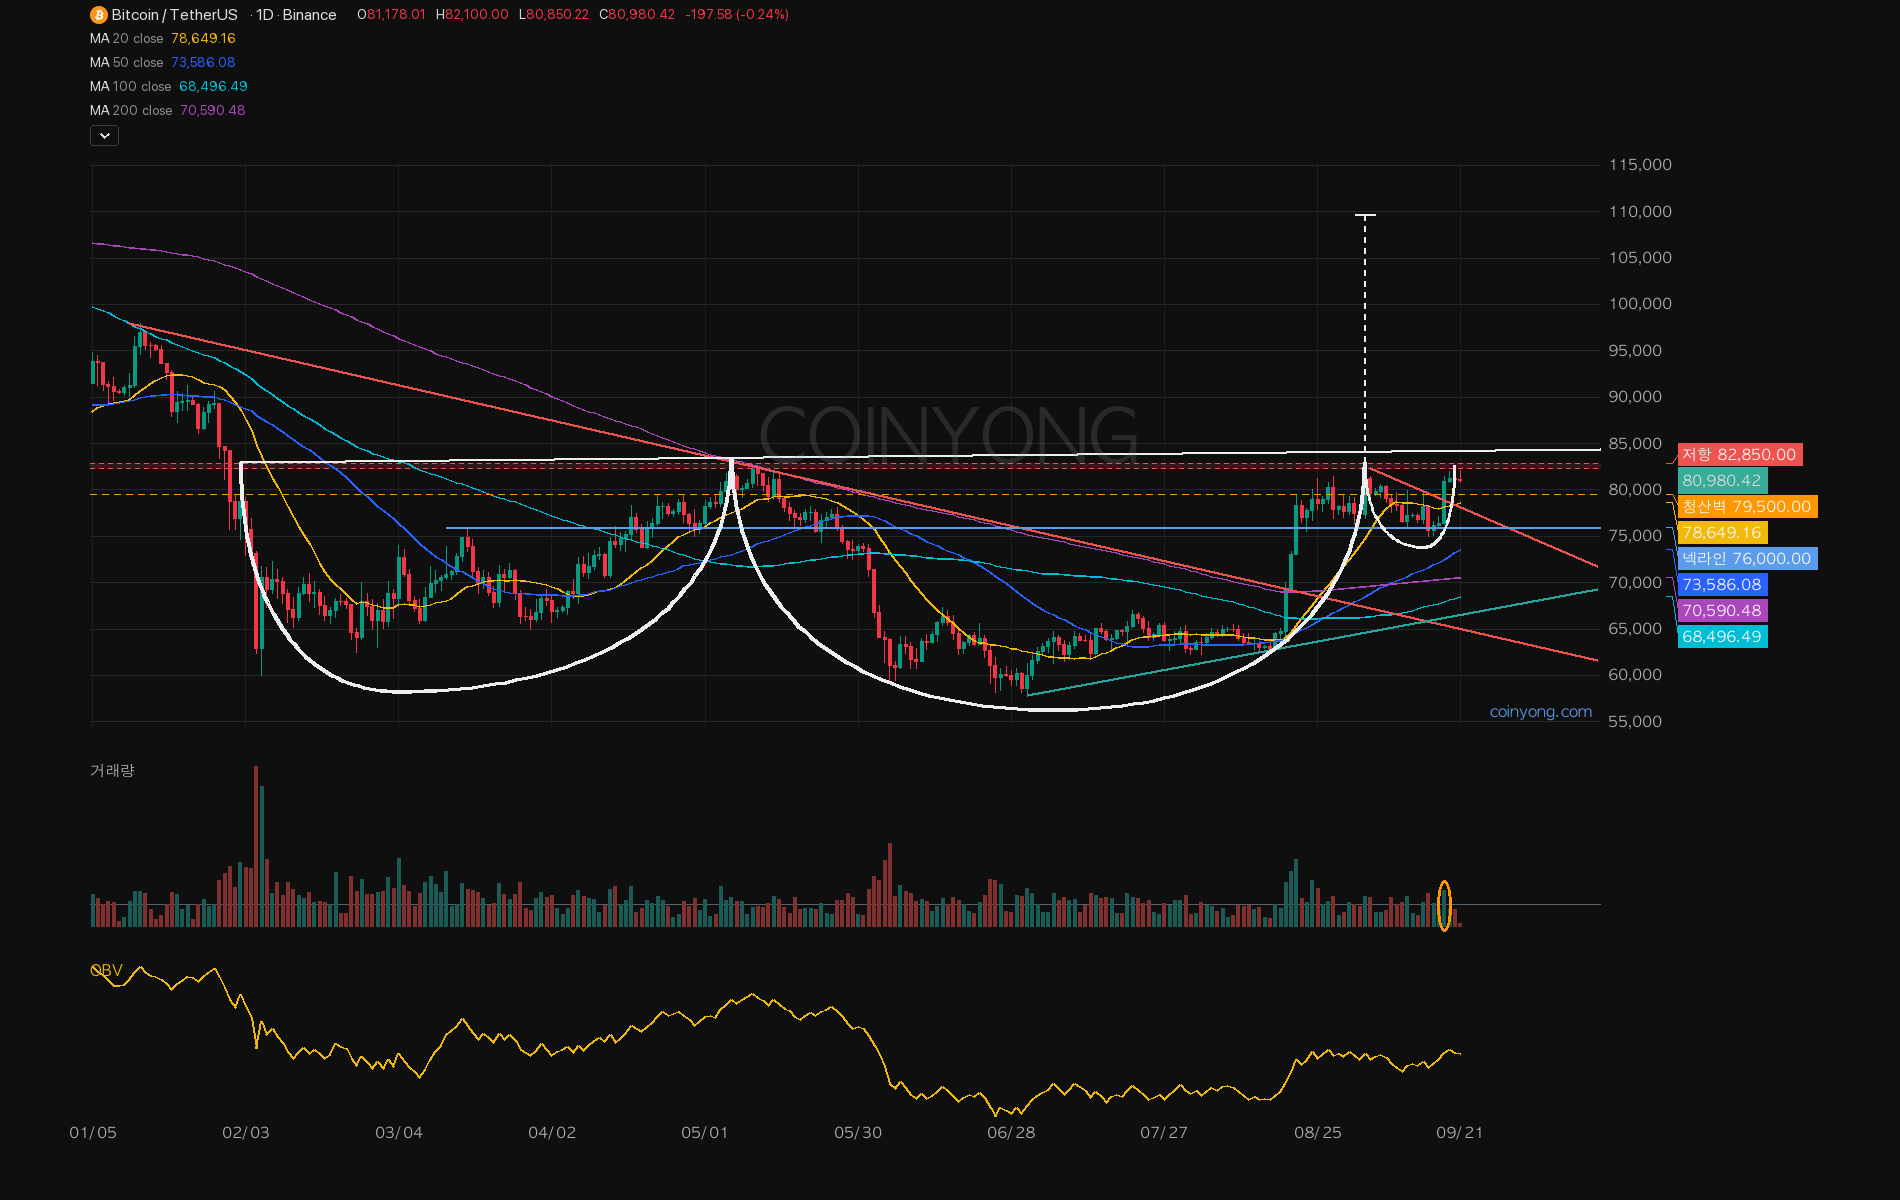
On the daily, Bitcoin (BTC) has formed a cup and handle: down from the May high of 82850 to 57800 in July, then back up to 82300 in early September. The pullback to 74968 on September 15 is the handle, and with a depth of roughly 9%, it's a textbook shape.
An inverse head and shoulders overlaps at the same spot. 60000 in February is the left shoulder, 57800 in July the head, 62535 in August the right shoulder, and the neckline is the March high at 76000. Price closed above the neckline on August 21, and last week's dip stopped right on that line, so the retest is done as well.
82300 to 82850, where both patterns point, is this week's wall — and it's also the top of the 76000–82300 range that has held for five weeks.
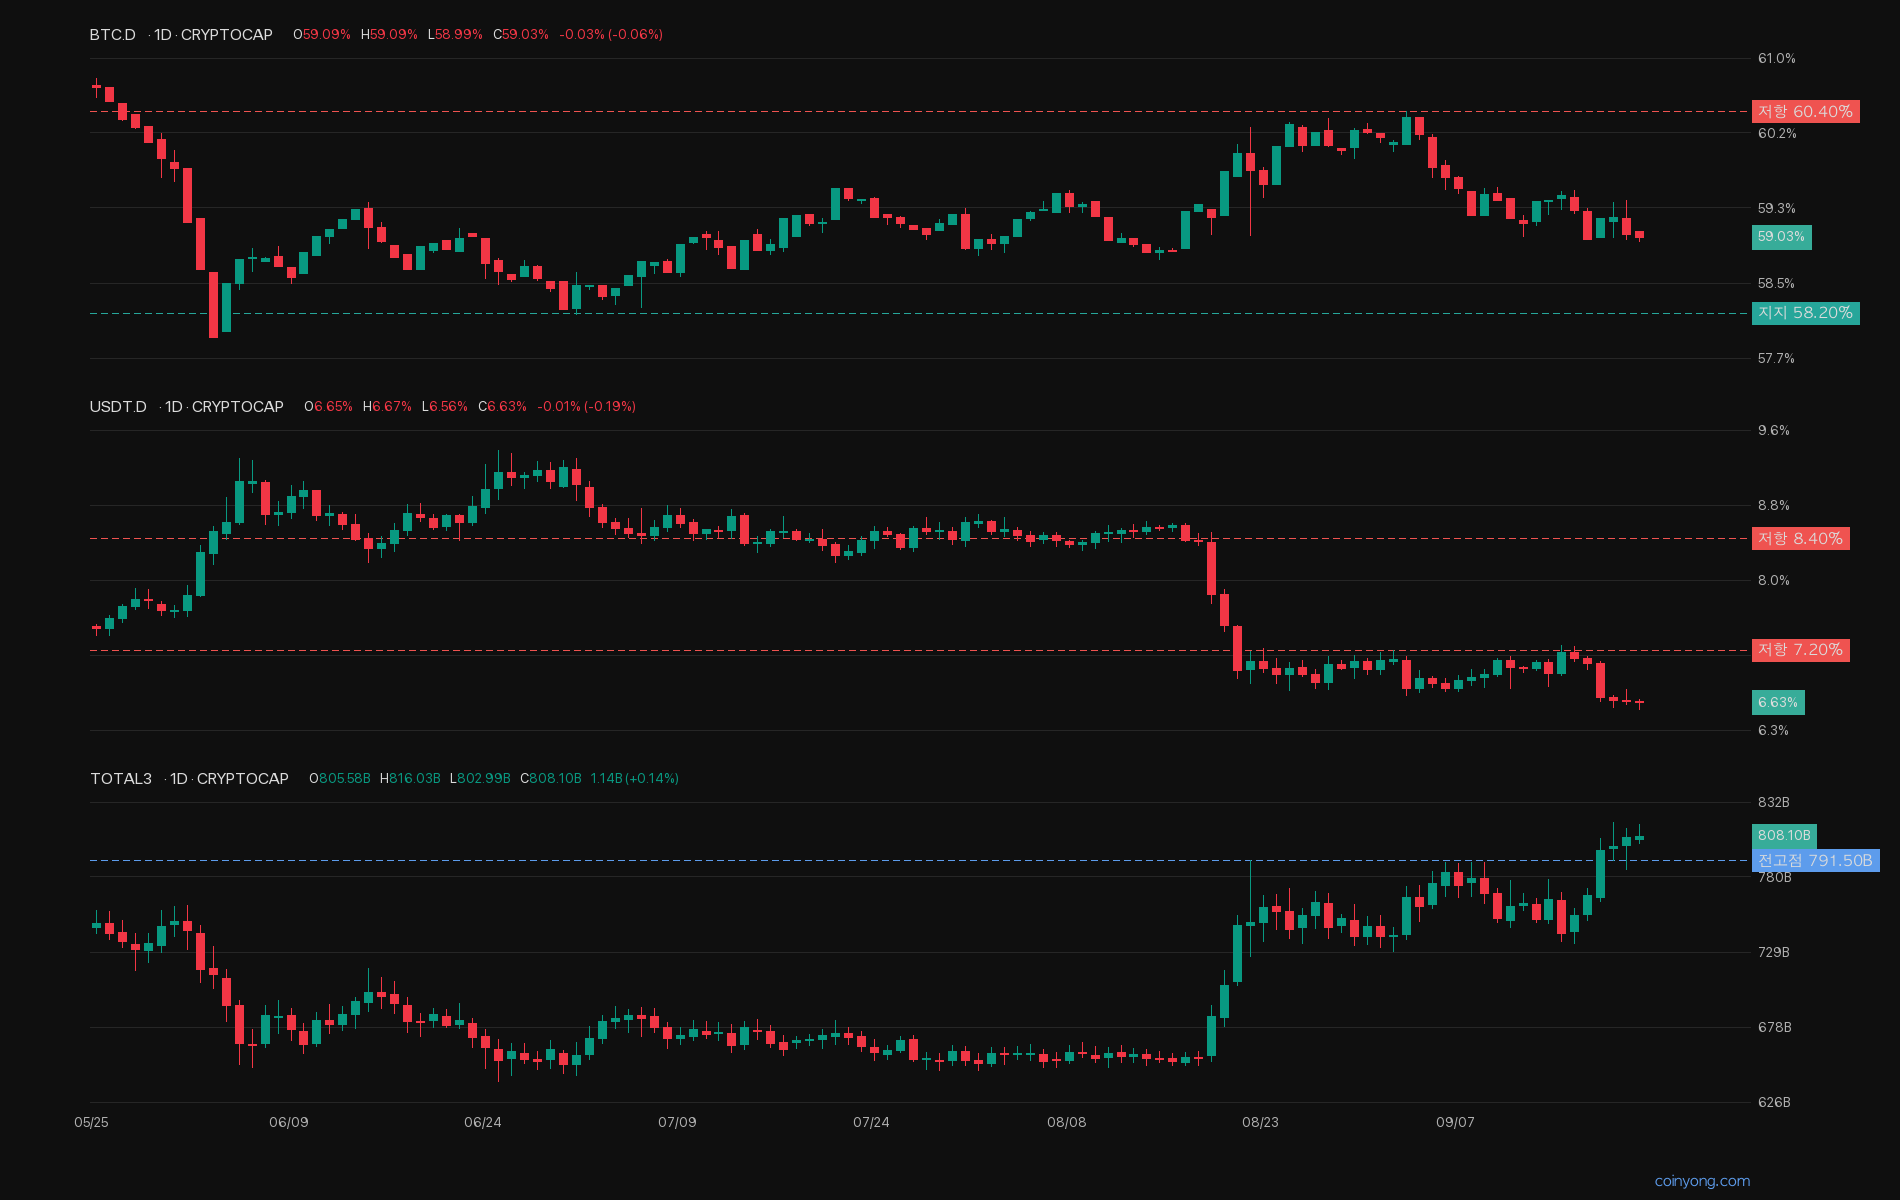
Looking at dominance to see where money is going while BTC moves sideways under resistance, the picture is a bit different. BTC dominance has slipped from 60.4 in early September to 59, and USDT dominance turned down from 8.4 to below 7 during the August 21 spike, then fell again to 6.6 last week. Altcoin market cap has broken above its August high to a new high. Money leaving stablecoins is going into alts first rather than BTC, so if it feels like BTC is stuck while only alts rise, that's exactly right.
The CLARITY Act stalled in the Senate, but the CFTC sent its exchange regulation proposal to the White House, and the SEC granted a temporary exemption for exchanges offering tokenized stocks. Spot ETFs took in $480 million in two days, and more than $400 million in short liquidations on the day of the spike pushed price straight up. The community is already full of posts about adding to positions and talk of 100K, and the Fear & Greed Index is at 70, in greed territory. Saylor apparently bought again, too, as soon as people started calling it a dead-cat bounce.
That said, volume has stayed below normal every day since the spike, and top traders are 68% long, so positioning is skewed long. Long liquidations are clustered below at 79600–80400, so if there's a shakeout before the breakout, a dip to that zone is likely.
I'm leaning toward both patterns completing. A daily close above 82850 puts the inverse head-and-shoulders measured-move target near 94000, and the cup target is higher still. Conversely, a daily close below 79500 breaks the handle, putting the 76000 neckline back in view — and losing 76000 invalidates both patterns.
This week has the Chuseok holiday plus the options expiry on the 25th, so if there's an attempt at 82300, the first thing to check is whether volume comes in. With money rotating into alts first, we also need to see whether that money flows back into BTC when it breaks 82850. Two big patterns resolving at the same level doesn't happen often, so I'll probably be opening the chart a lot this week too.
 ETH
ETH LINK
LINK