BTC Hugs Its Downtrend, Bands Squeeze Ahead of Jackson Hole
 Coinyong
 BTC
BTC
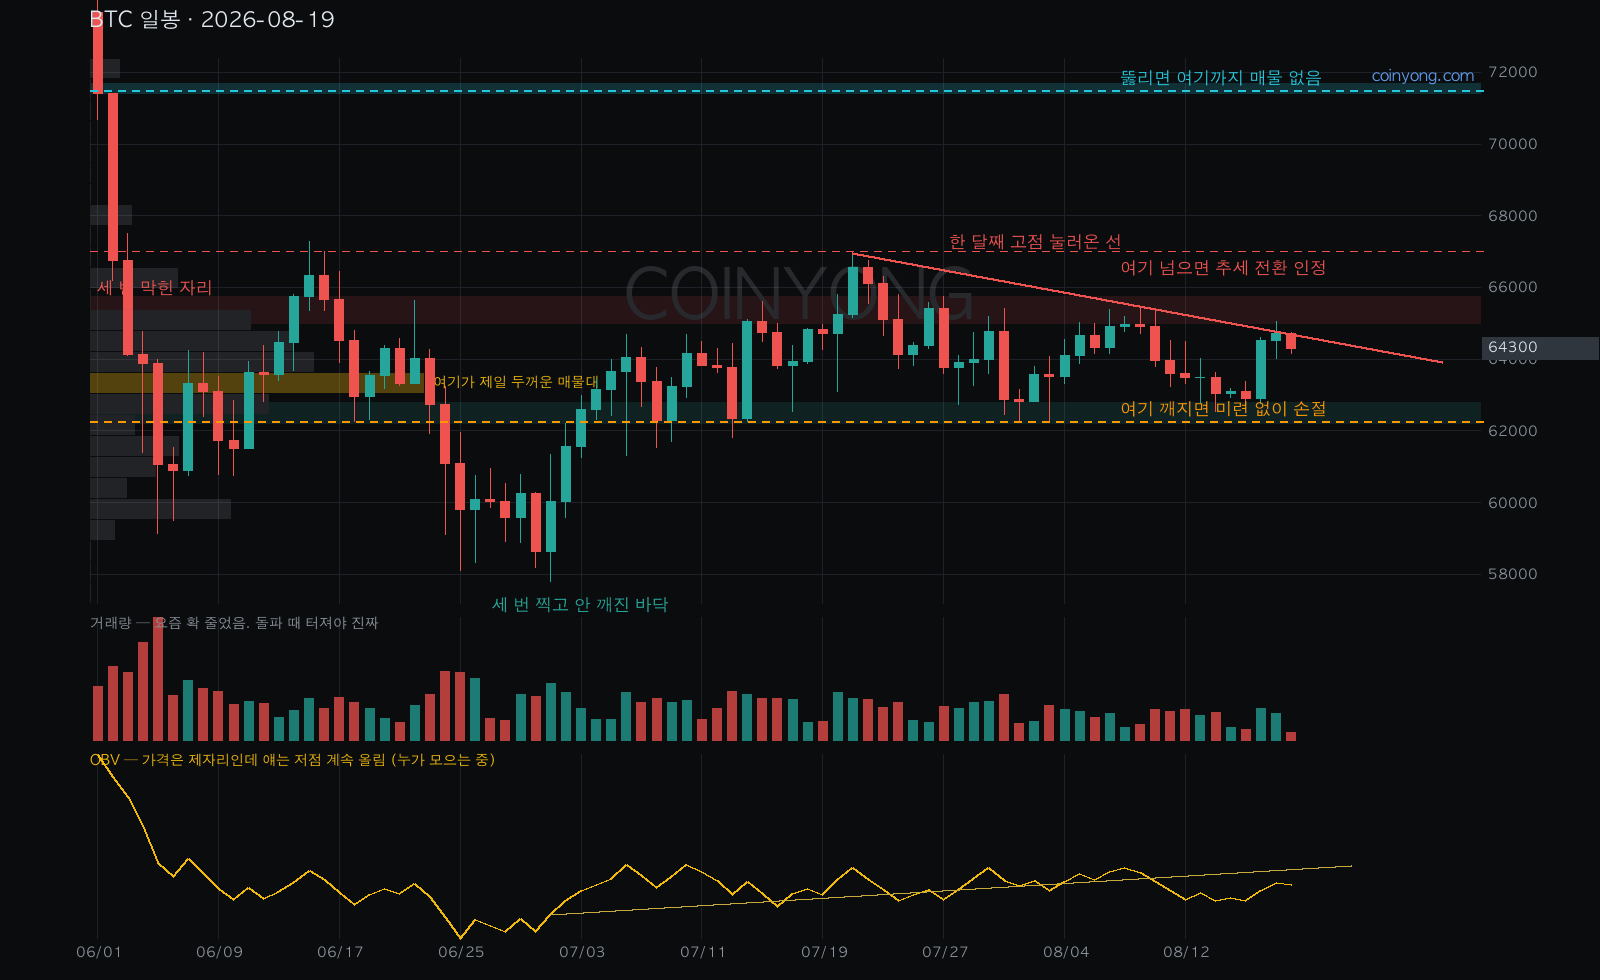
BTC is chopping around 64300 today, and the chart setup is interesting. Price is sitting right on the downtrend line that has been capping highs since July, and 65000–65500 has rejected it three times recently, so this looks like the key hurdle.
The Bollinger Bands have also tightened sharply over the past month — band width has shrunk from 11% to the 4% range. When the bands get squeezed like this, a big move in one direction usually follows soon. Volume has dropped off too, so it really feels like the calm before the storm.
Under the hood, though, things don't look bad. Someone keeps buying every dip — OBV keeps making higher lows — and the heaviest volume shelf sits around 63400, so price isn't sliding as easily as you'd expect. The fact that it tagged the 58000 area three times in June and July without breaking adds to that.
RSI is at 52, so nothing is overheated and there's still room to run.
The problem is Jackson Hole tomorrow. One comment could swing it hard either way, so I'm not getting in early — I'll follow only after a break above 65500 on real volume. Clear that and 67000 is next, and with thin supply above, 71500 could open up surprisingly fast.
If 62275 breaks, I just walk away. Below that it's air all the way to 58000.
Good luck out there — just my take.
 ETH
ETH LINK
LINK