Bitcoin Stalls Below 85K Again — Is 80K Support Up for Another Test?
 Coinyong
 BTC
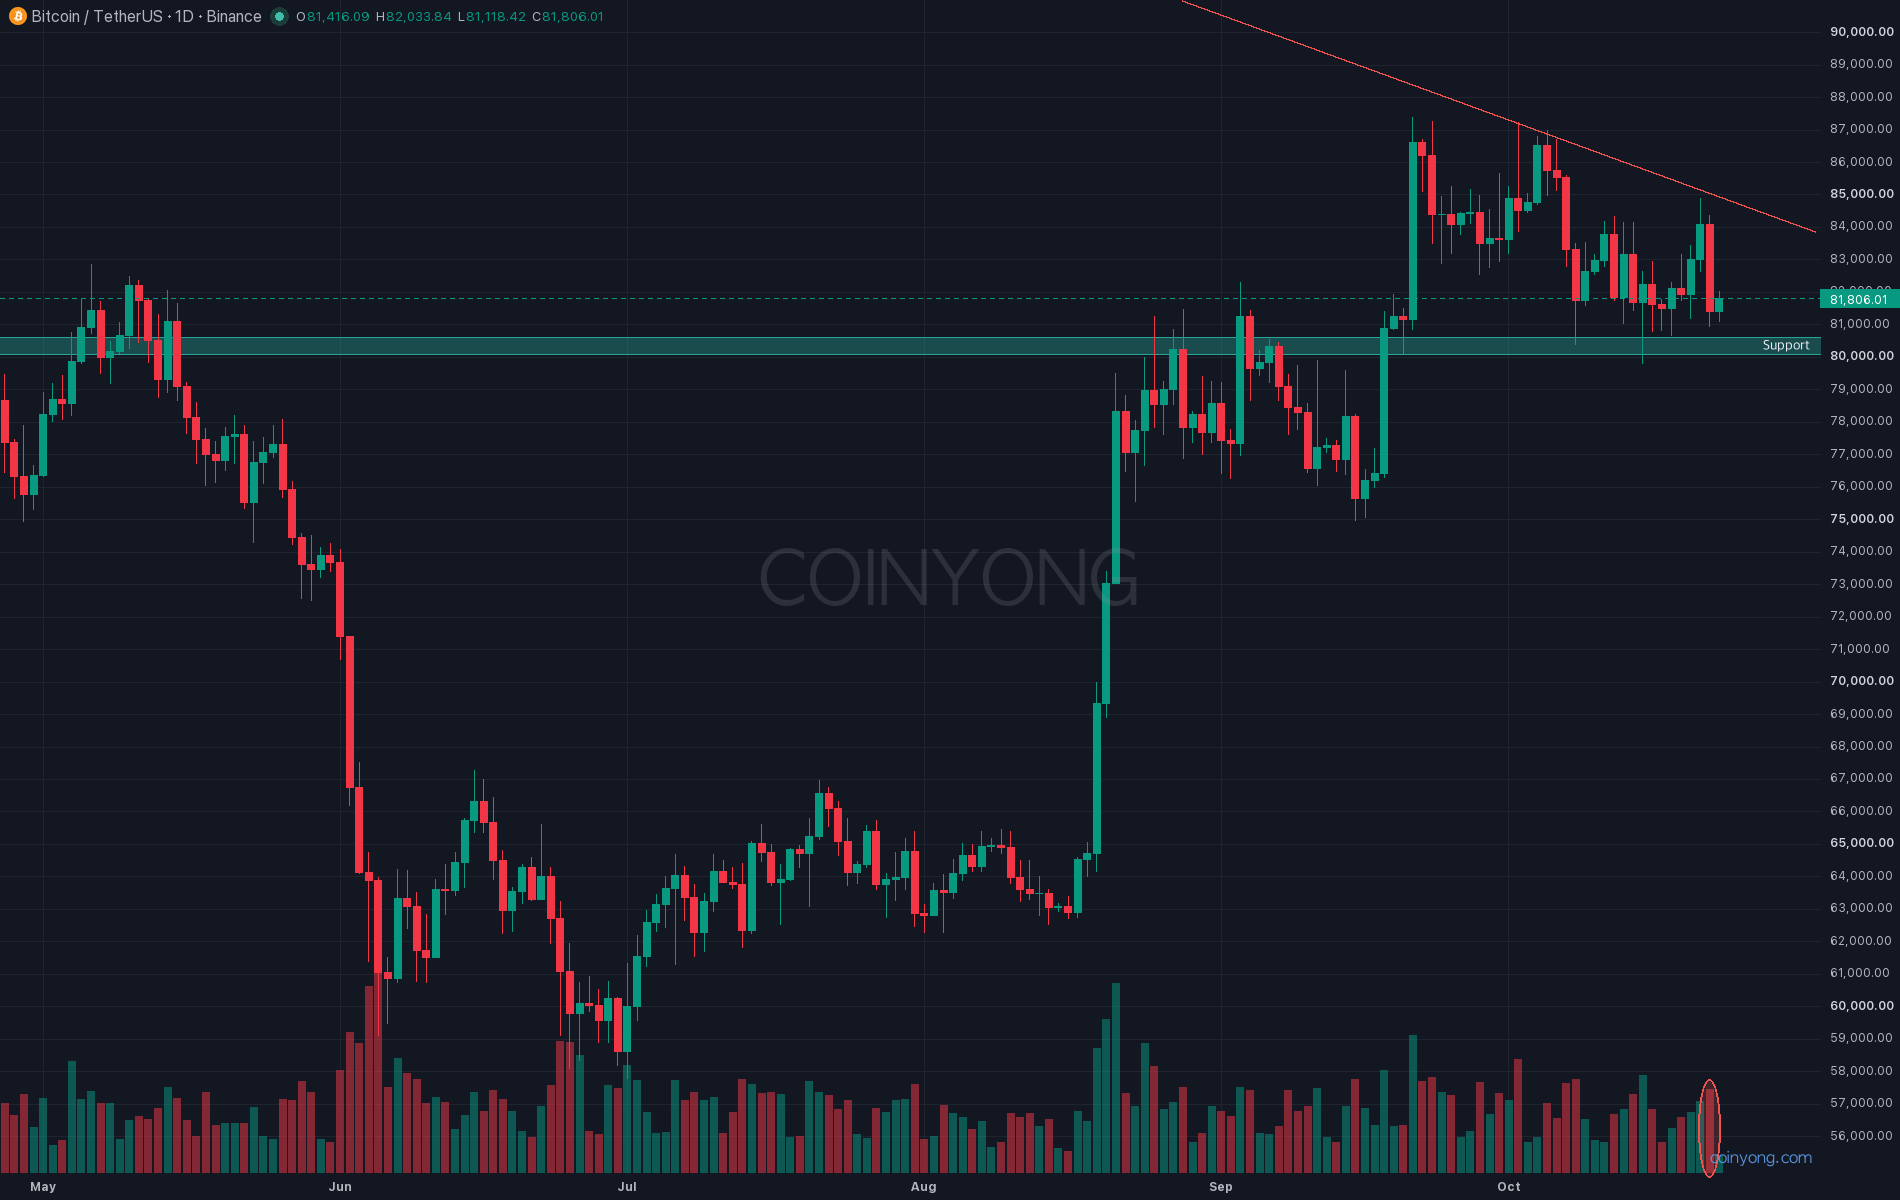
Money that flowed in for three days left in one. US spot Bitcoin ETFs took in more than $1 billion over the three days starting the 19th, then saw over $600 million leave on the 22nd (US time) alone. Was the bounce up to 85K the real thing?
Bitcoin wasn't the only one looking weak. Ethereum dropped by a similar amount the same day, and decliners far outnumbered gainers among altcoins. Money left the whole market that day.
Bitcoin (BTC) climbed to just below 85K on Wednesday night and stalled there. The daily candle still closed above 84K, but on Thursday it fell more than 3% in a single day to close at 81.4K. In my last post I was looking for a slide to 77–78K this week and set a daily close above 84K as the invalidation, and Wednesday's daily close at 84.1K hit that condition. But the breakout didn't last a day before price fell back inside the range.
What matters here is where it stalled. A one-year downtrend line running from last year's all-time high now sits around 85K, and this week's high stopped right underneath it. The same line also capped the September and early-October highs, so it's not a level that gives way easily.
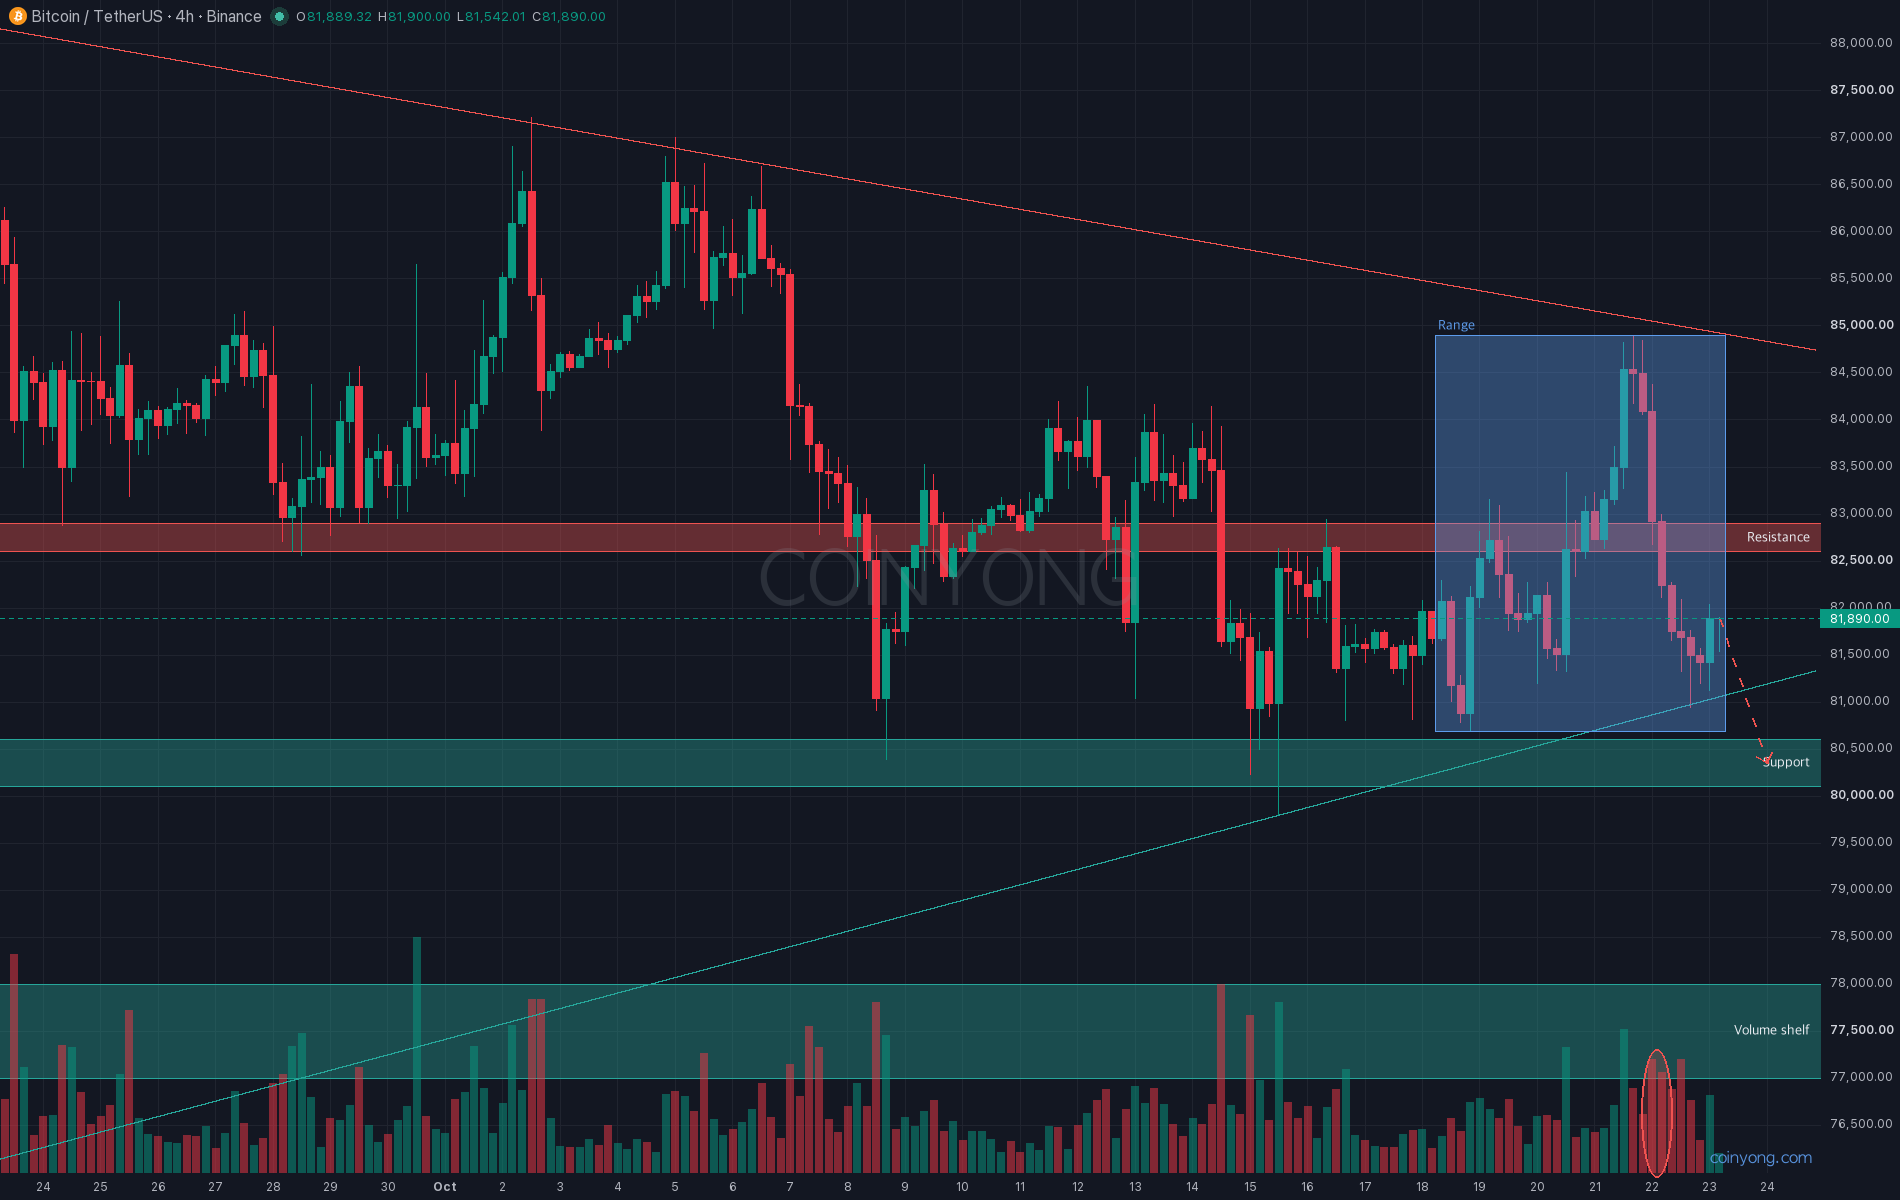
Here's the BTC 4-hour chart. Price is in the lower part of the range that's held since last weekend. Just above, at 82.6–82.9K, several 4-hour downtrend lines and horizontal highs stack up, and the 4-hour moving averages all sit around there, overhead. Even if price bounces, that's an easy place for it to stall.
Below, a rising support line from mid-September is holding around 81K, and beneath that sits 80.1–80.6K, where October's lows cluster. A large bid wall on the futures order book is parked around there too.
Order flow leans to the downside. Over the past day, orders larger than $1 million showed over $200 million in net selling, with only small orders on the buy side. Thursday's down candle also printed more volume than Wednesday's up candle. Top traders are 60% long, so if price slips, the cluster of long liquidations just below could pull it lower. On the other hand, small orders keep buying, so the floor isn't completely without support.
In short, this week's high got capped by the one-year downtrend line, and large orders are on the sell side. Personally, I'm leaning toward price giving up the 81K rising support and retesting the 80.1–80.6K support below the range. A 4-hour close below 80K opens the way to 77K–78K, where a high-volume zone sits. On the other hand, a daily close above 85K invalidates this view, and then a retest of the 87K highs is on the table.
- Key resistance 82.6K - 82.9K (where a bounce stalls first)
- First support 80.1K - 80.6K
- Next support 77K - 78K
Ahead of next week's FOMC meeting, the thing to watch is whether buyers step in again above 80K.
 SOL
 ETH