Solana: If the Range Low Breaks, Is 112 Next?
 Coinyong
 SOL
SOL
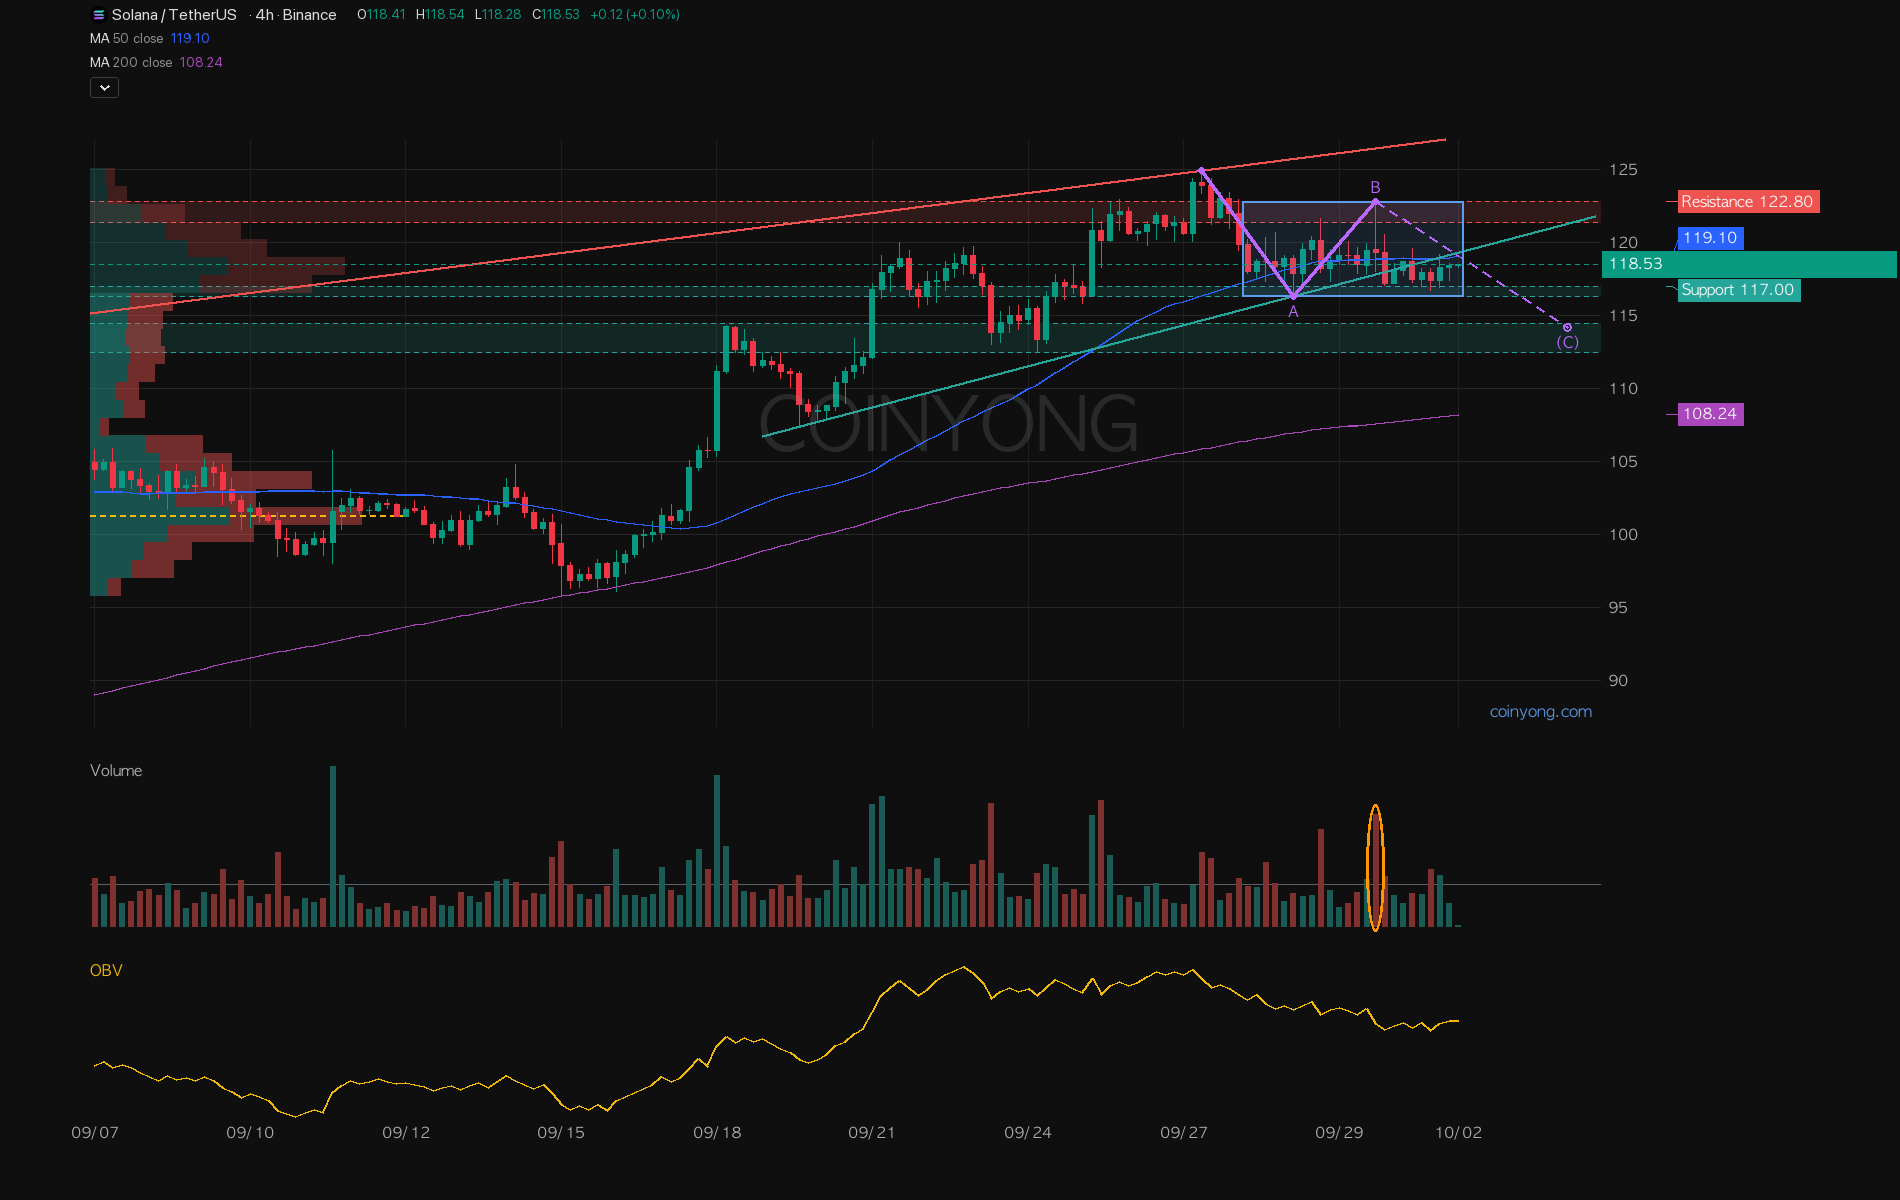
Solana (SOL) was rejected at 123 three times last week, then on Sunday it briefly climbed above the previous high before sliding back to the bottom of the box. No 4H candle has closed below it yet, and it hasn't reached the support below.
The main chart is the 4H. On Wednesday night a candle pushed into the red resistance zone, left nothing but a long upper wick, with heavy volume as the orange circle shows. The very next candle lost the green rising line that had been holding the lows since mid-September. Yesterday one candle closed back above it, but the next one fell right back under and it hasn't gotten over since. Highs keep stepping down while the lows hug the green support zone. The selling pressure from above is slowly moving lower. It isn't confirmed yet, but if this plays out as an A-B-C like the purple line, C would be an A-sized drop to around 114.
The yellow OBV line below has also been sliding since Sunday's high. Price is going sideways while OBV drops, which points to heavier selling pressure inside the box. When BTC rose 1.5% yesterday, Solana didn't move, and total altcoin market cap shrank this week. On the volume profile at left, there was a lot of trading inside the box but very little just below it. If the bottom breaks, there isn't much there to catch it.
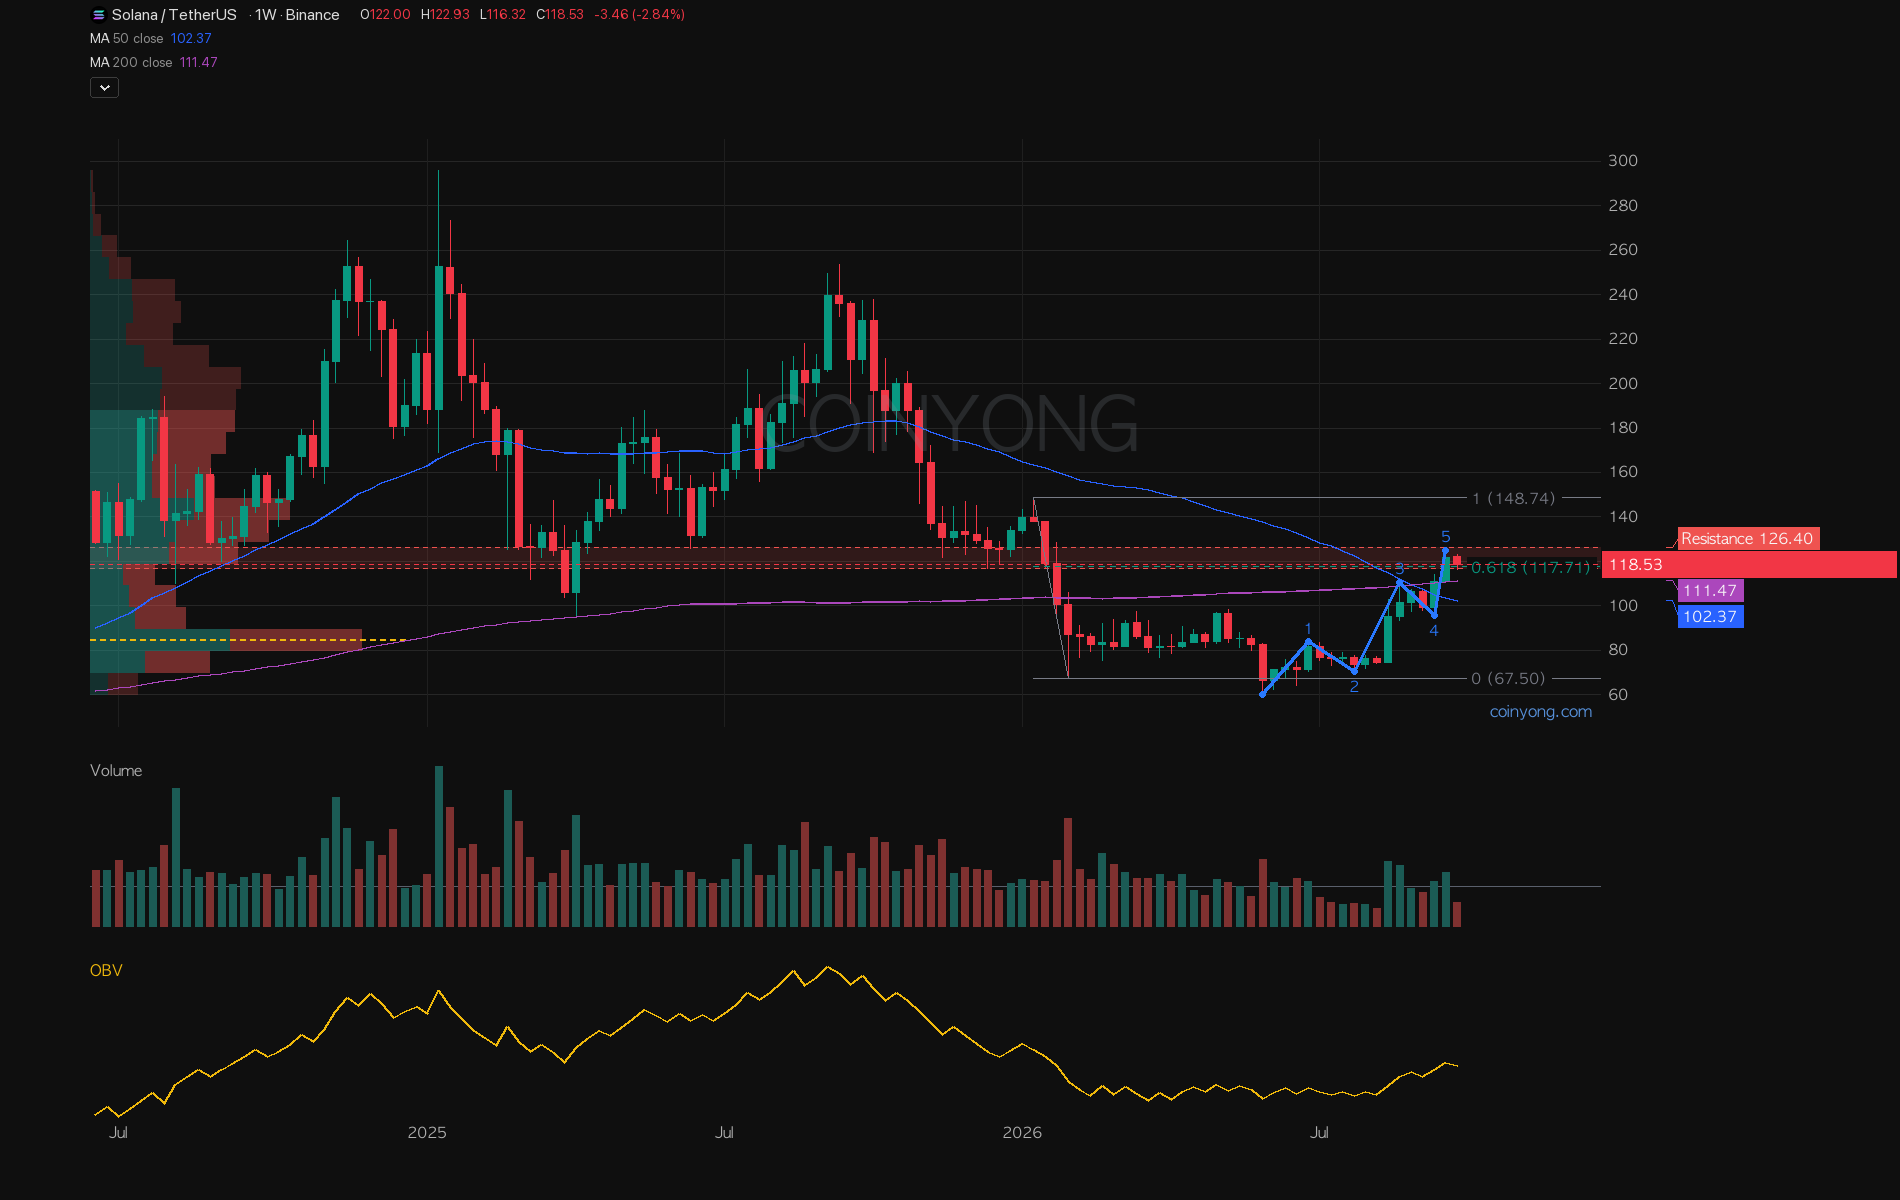
The weekly chart shows why it keeps getting stuck here. The red zone is where last November and December's lows clustered, and since it broke in late January, old support has turned into resistance. The 0.618 retracement of the January~February crash also sits inside it, and the volume profile gets thicker from here up. Price has climbed in five waves from the June low, and wave 5 has already hit its target. Even if it pushes higher, the upside looks limited to around 127, so there's a good chance the rally is wrapping up here.
- Key resistance 121.4~122.8
- First support 116.3~117
- Next support 112.5~114.5
Over the weekend I think a break below the box bottom and a slide to the next support is more likely. That zone lines up with last Thursday's low and a big bid wall on the futures order book. On the other hand, if a 4H candle clears the red resistance zone and closes above 122.8, the bearish view is off, and I'd look for a retest of the high and leave room up to the red rising resistance line above it. The daily moving averages are all still pointing up, so if the bottom holds, this pullback could end quickly.
It's been a boring week with no sign of the rally people were waiting for. This time a pullback first looks more likely.
 ETH
ETH BTC
BTC LINK
LINK