ETH Tags $2,356 and Turns Right Around
 Coinyong
 ETH
ETH
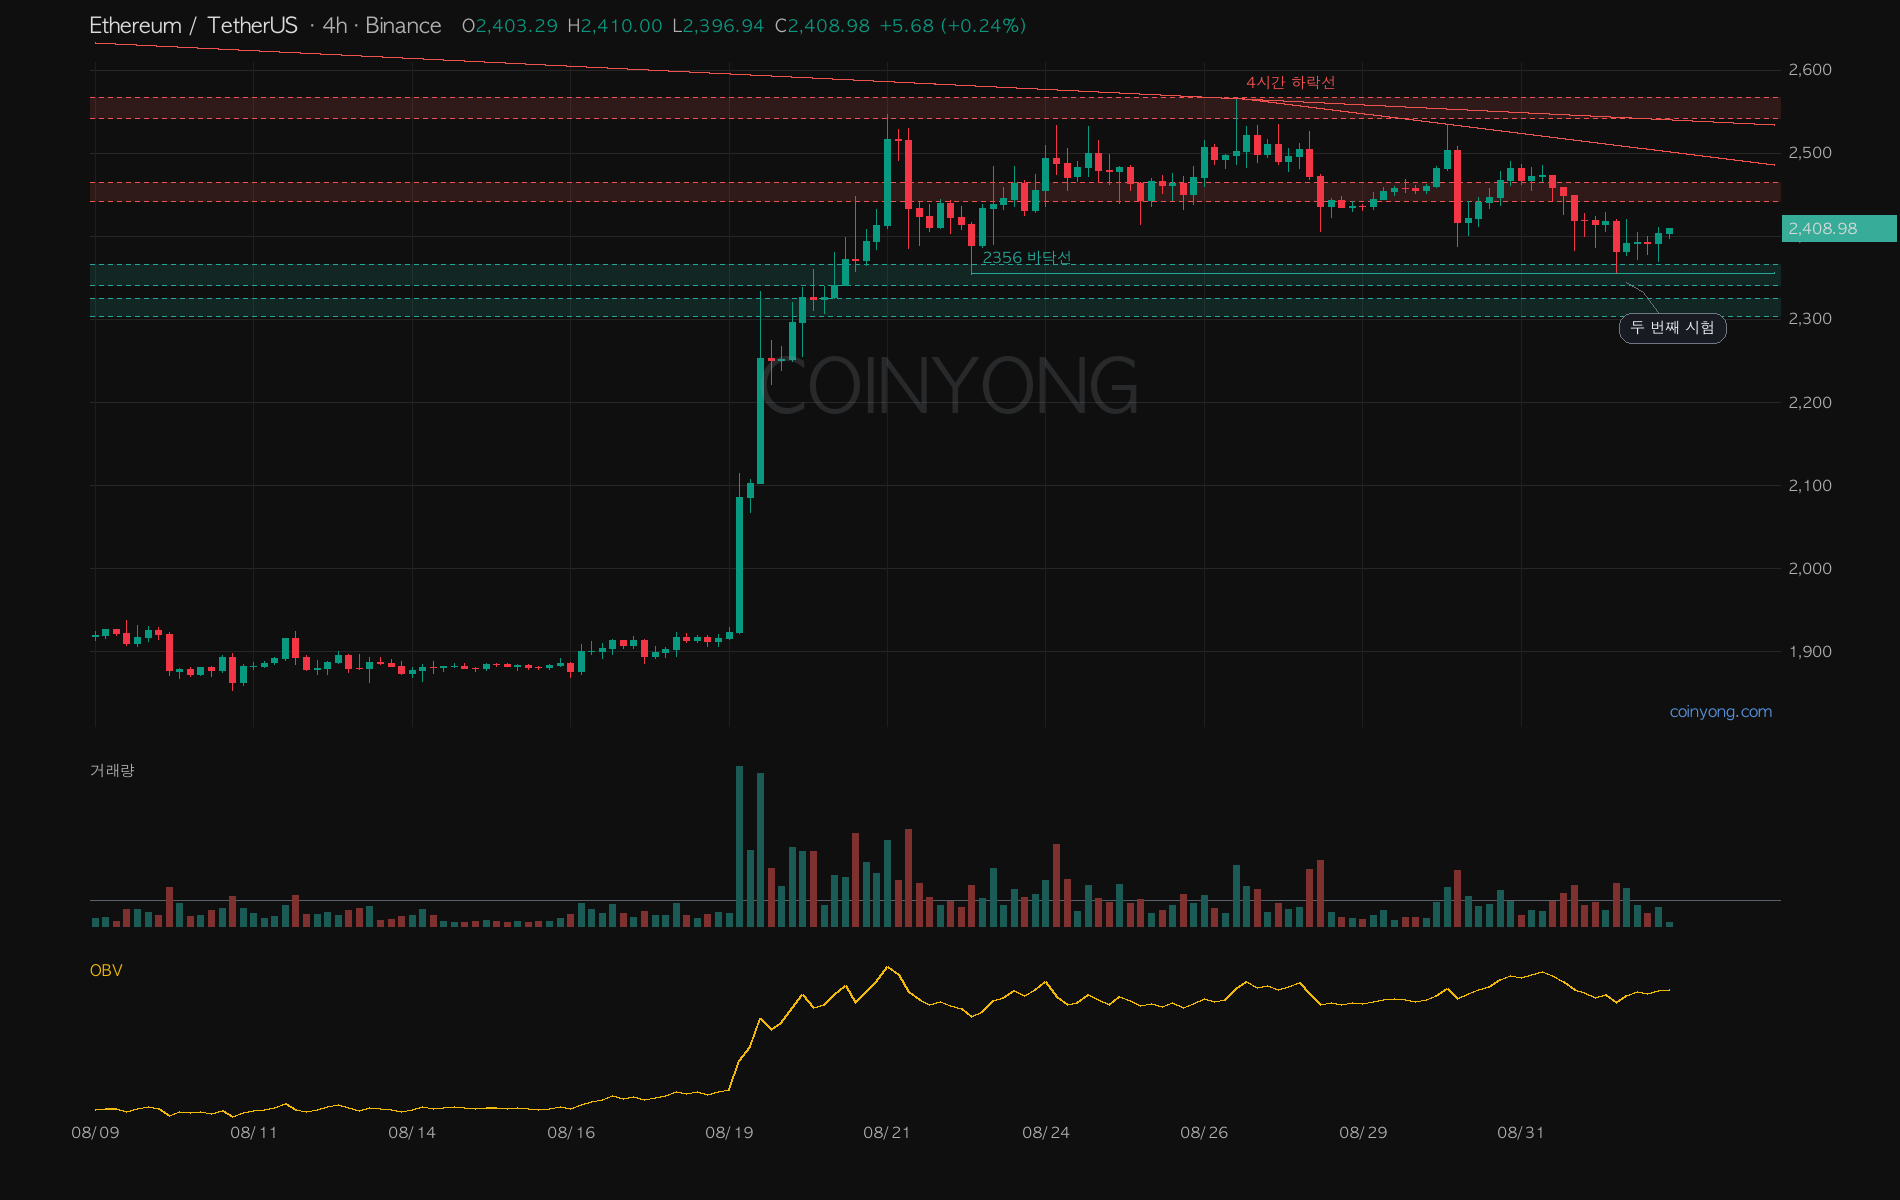
In my last post I said that if Ethereum (ETH) gave up $2,356, this rally's structure would be over — and yesterday's low was $2,356.41. It tagged almost exactly that level and closed back up at $2,391.92.
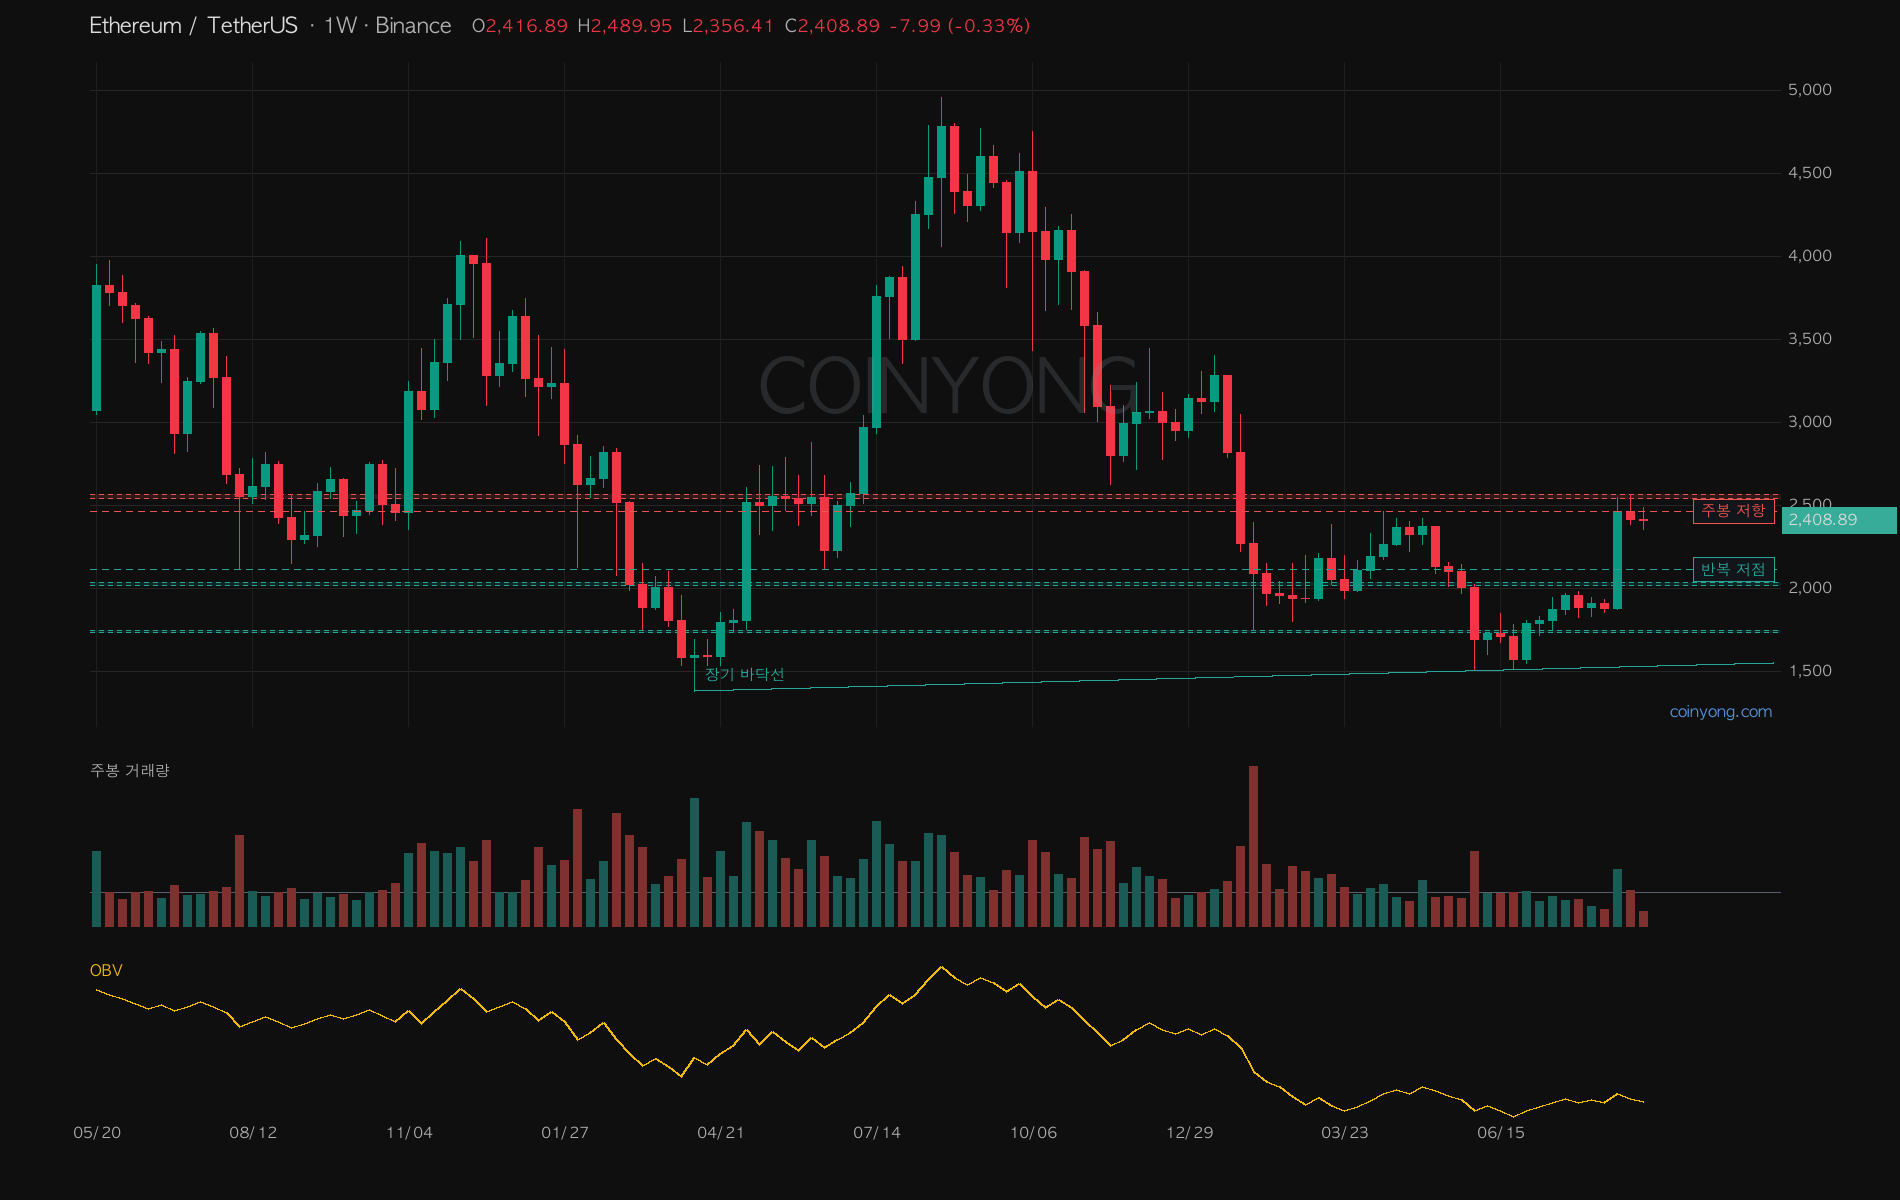
Starting with the weekly, the long-term floor line connecting the April 2025 low and this June's low has never been broken. It's some distance from the current price, though, and just overhead the 50-week MA and the recent highs are clustered at $2,542–2,567.
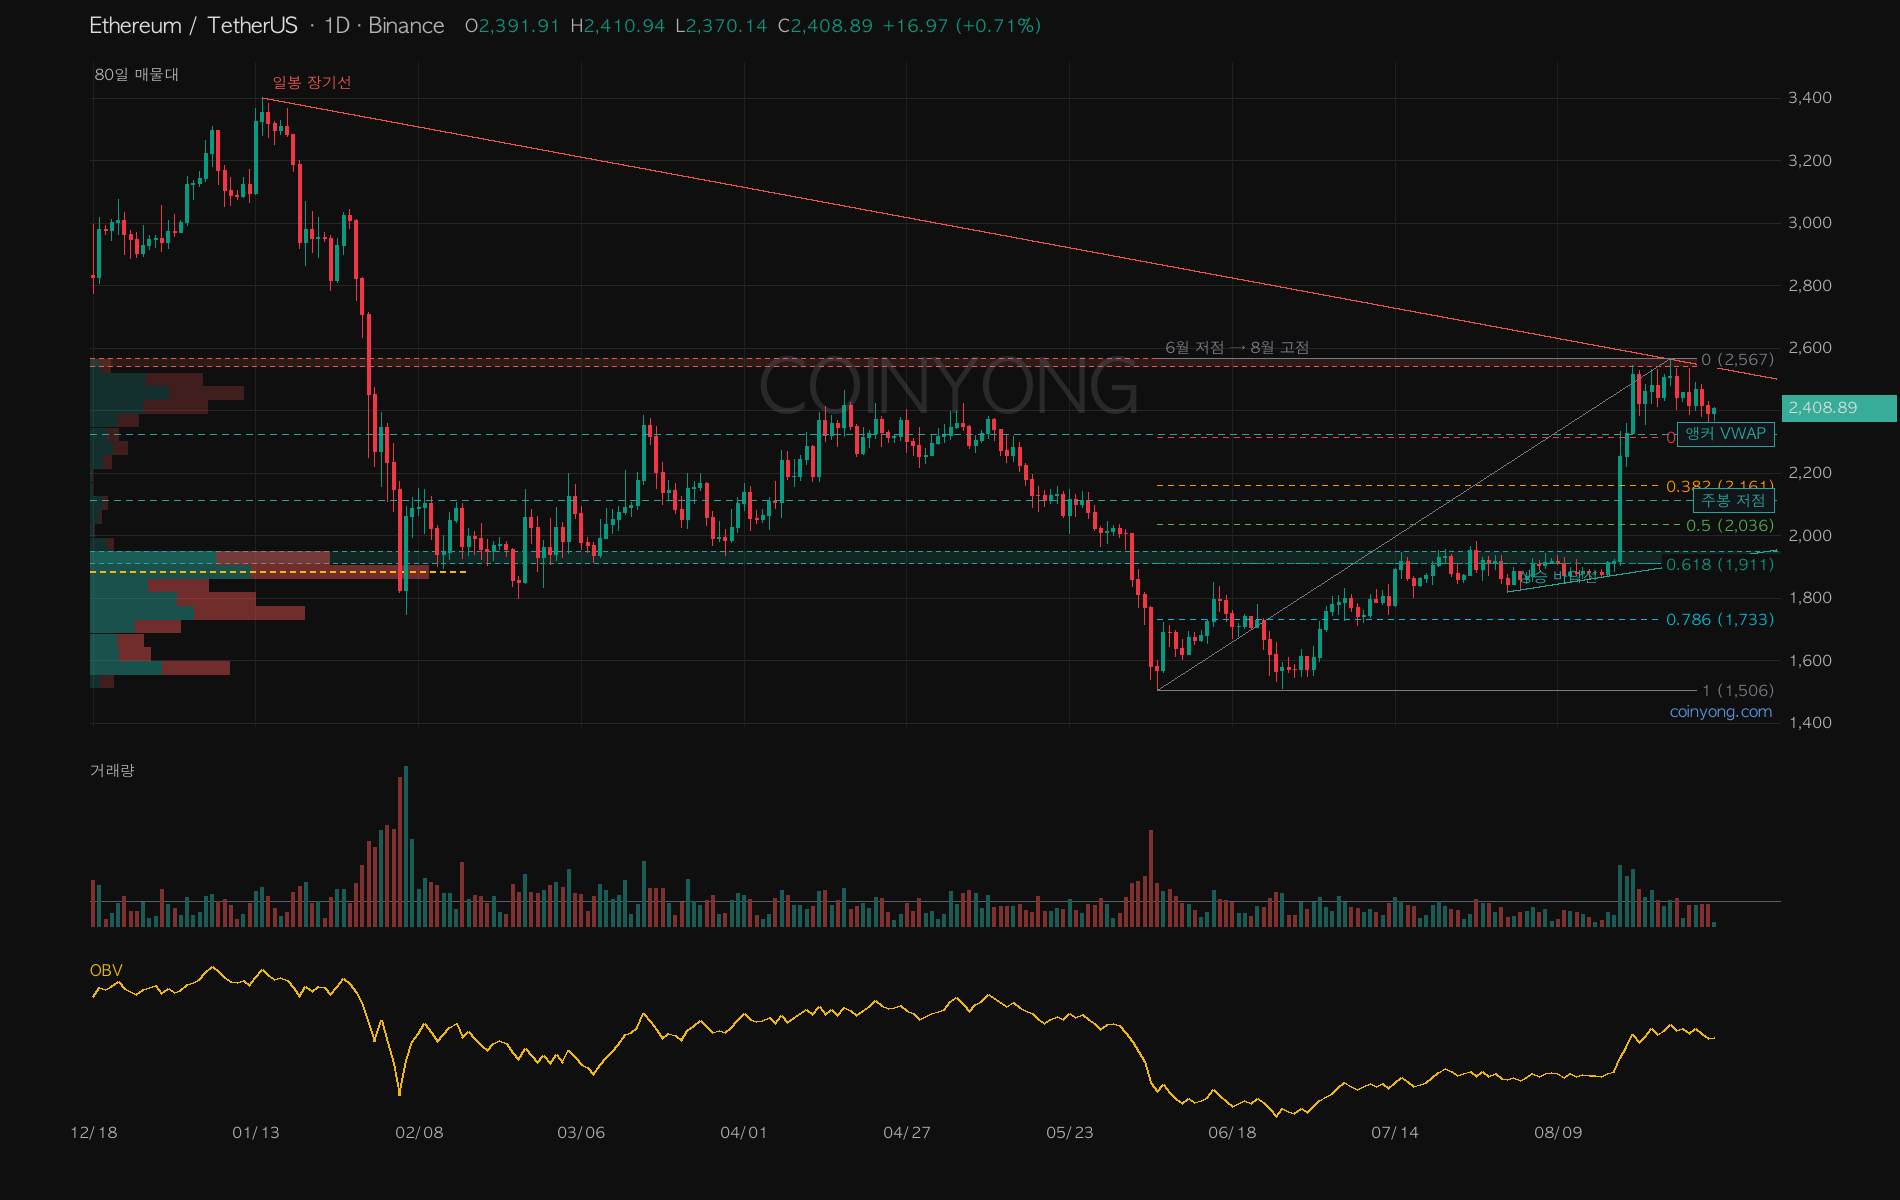
On the daily, the long-term line coming down from the January high runs through that same $2,542–2,567 zone. Highs haven't crossed it since, and as the price high rose from $2,547 to $2,567, the RSI high fell from 88.3 to 77.5.
The bigger structure below is still alive. Lows have been rising since $1,506 in June, and OBV lows have risen right along with them. But recent daily volume has remained below the 20-day average, so it's hard to say buying strength is back on the strength of this one wick.
The 4-hour is simpler. Price sits between the descending trendline from $2,567 and the $2,356 floor line, and this was the floor's second test. There's an ask wall right above at $2,442, and large orders over the past 24 hours are skewed to the sell side too, so for now this is closer to holding on than to a confirmed bounce.
Reclaiming $2,442–2,465 opens the way to retest $2,542–2,567. Conversely, a daily close below $2,356 invalidates this structure, and next I'd watch the $2,304 bid wall and the $2,316 Fib zone.
With the jobs report out tomorrow night, whether this wick that stopped right at the last line can hold for one more day has become pretty important.
 BTC
BTC LINK
LINK