ETH Coiling Below $2,000 — Holding Up Better Than BTC
 Coinyong
 ETH
ETH
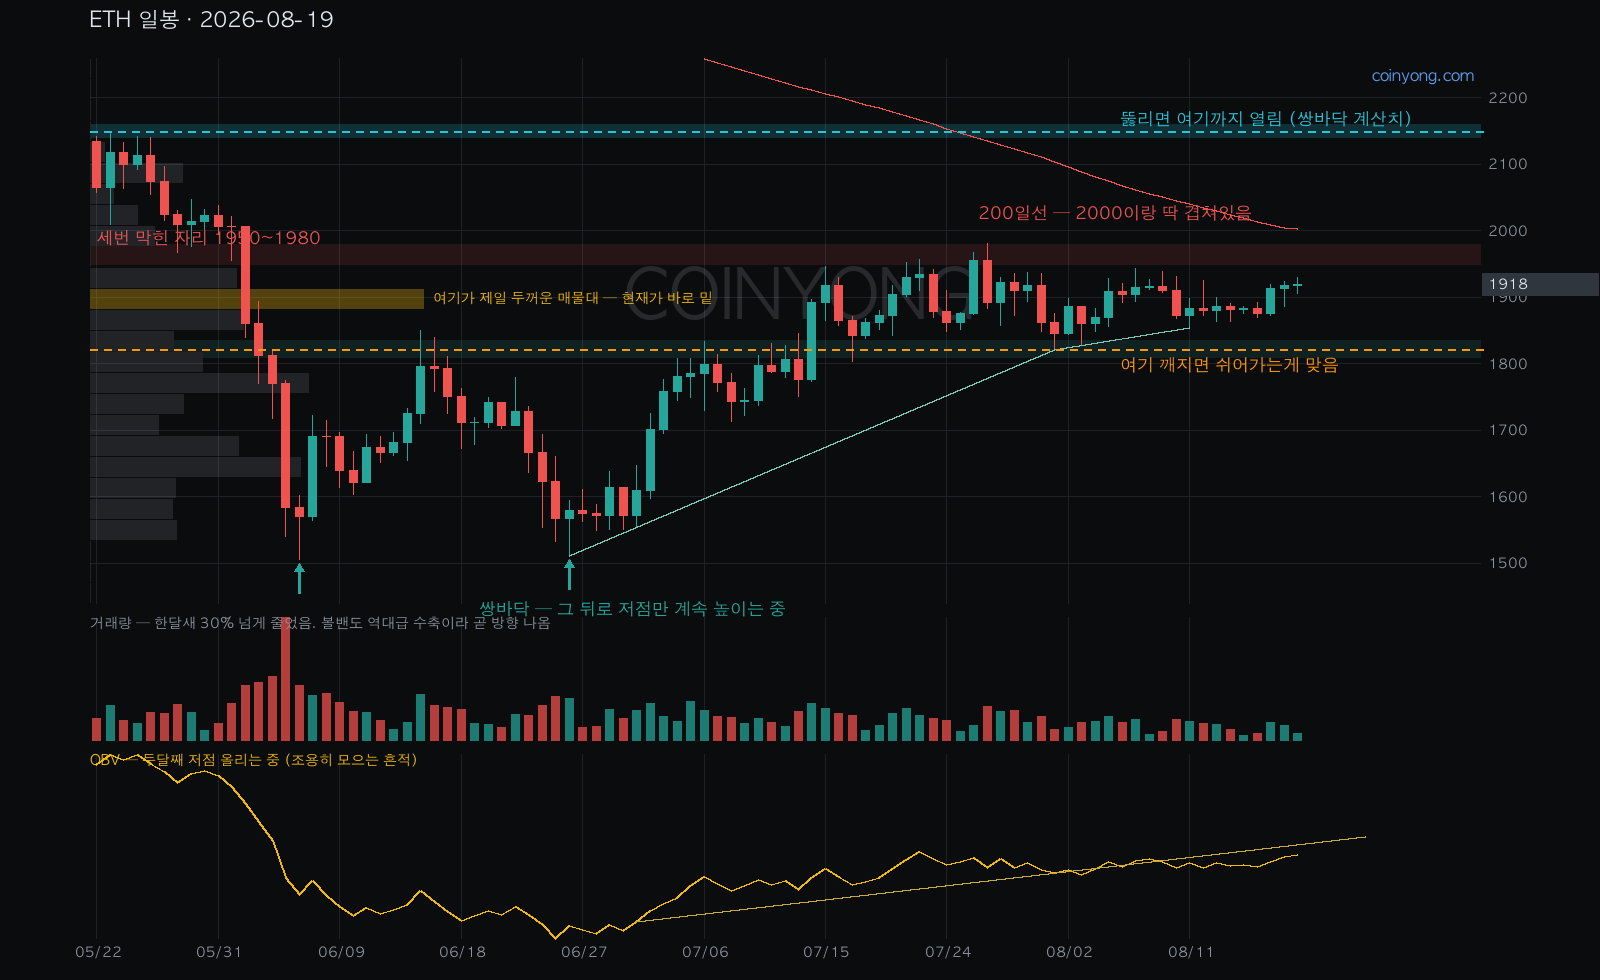
ETH is sitting around 1918, and its chart is a lot cleaner than Bitcoin's. It put in a double bottom at 1506 and 1512 in June and has kept making higher lows since — 1512 → 1822 → 1854, stepping up the whole way.
The Bollinger Bands have squeezed to near-record tightness. Band width was 20% a month ago and it's now 4.6%. Volume is down more than 30% too, so just like BTC, this is calm-before-the-storm territory.
Under the hood, OBV has been printing higher lows for two months, and the thickest volume-profile node sits around 1890, right below the current price, acting as a cushion. ETH/BTC is also up 2% over the past month, so lately ETH has been falling less than BTC on down days.
Overhead, 1950–1980 has rejected price three times, and right above that, 2000 and the 200-day MA (2003) line up almost exactly. That's the real gate. A round number stacked on the 200-day MA rarely breaks on the first try, but if it does, supply is thin all the way up to 2150. The double-bottom measured move lands right around there as well.
If 1822 breaks, it's time to step aside on this setup for now, because that would end the higher-low structure.
My plan is to watch how BTC digests Jackson Hole, and only follow ETH once the 2000 breakout is confirmed. Alts ultimately follow Bitcoin's direction, so the order matters.
Good luck out there — for reference only.
 BTC
BTC LINK
LINK