Ethereum's 2.3K Support Has Held for Over a Week — Will It Finally Break?
 Coinyong
 ETH
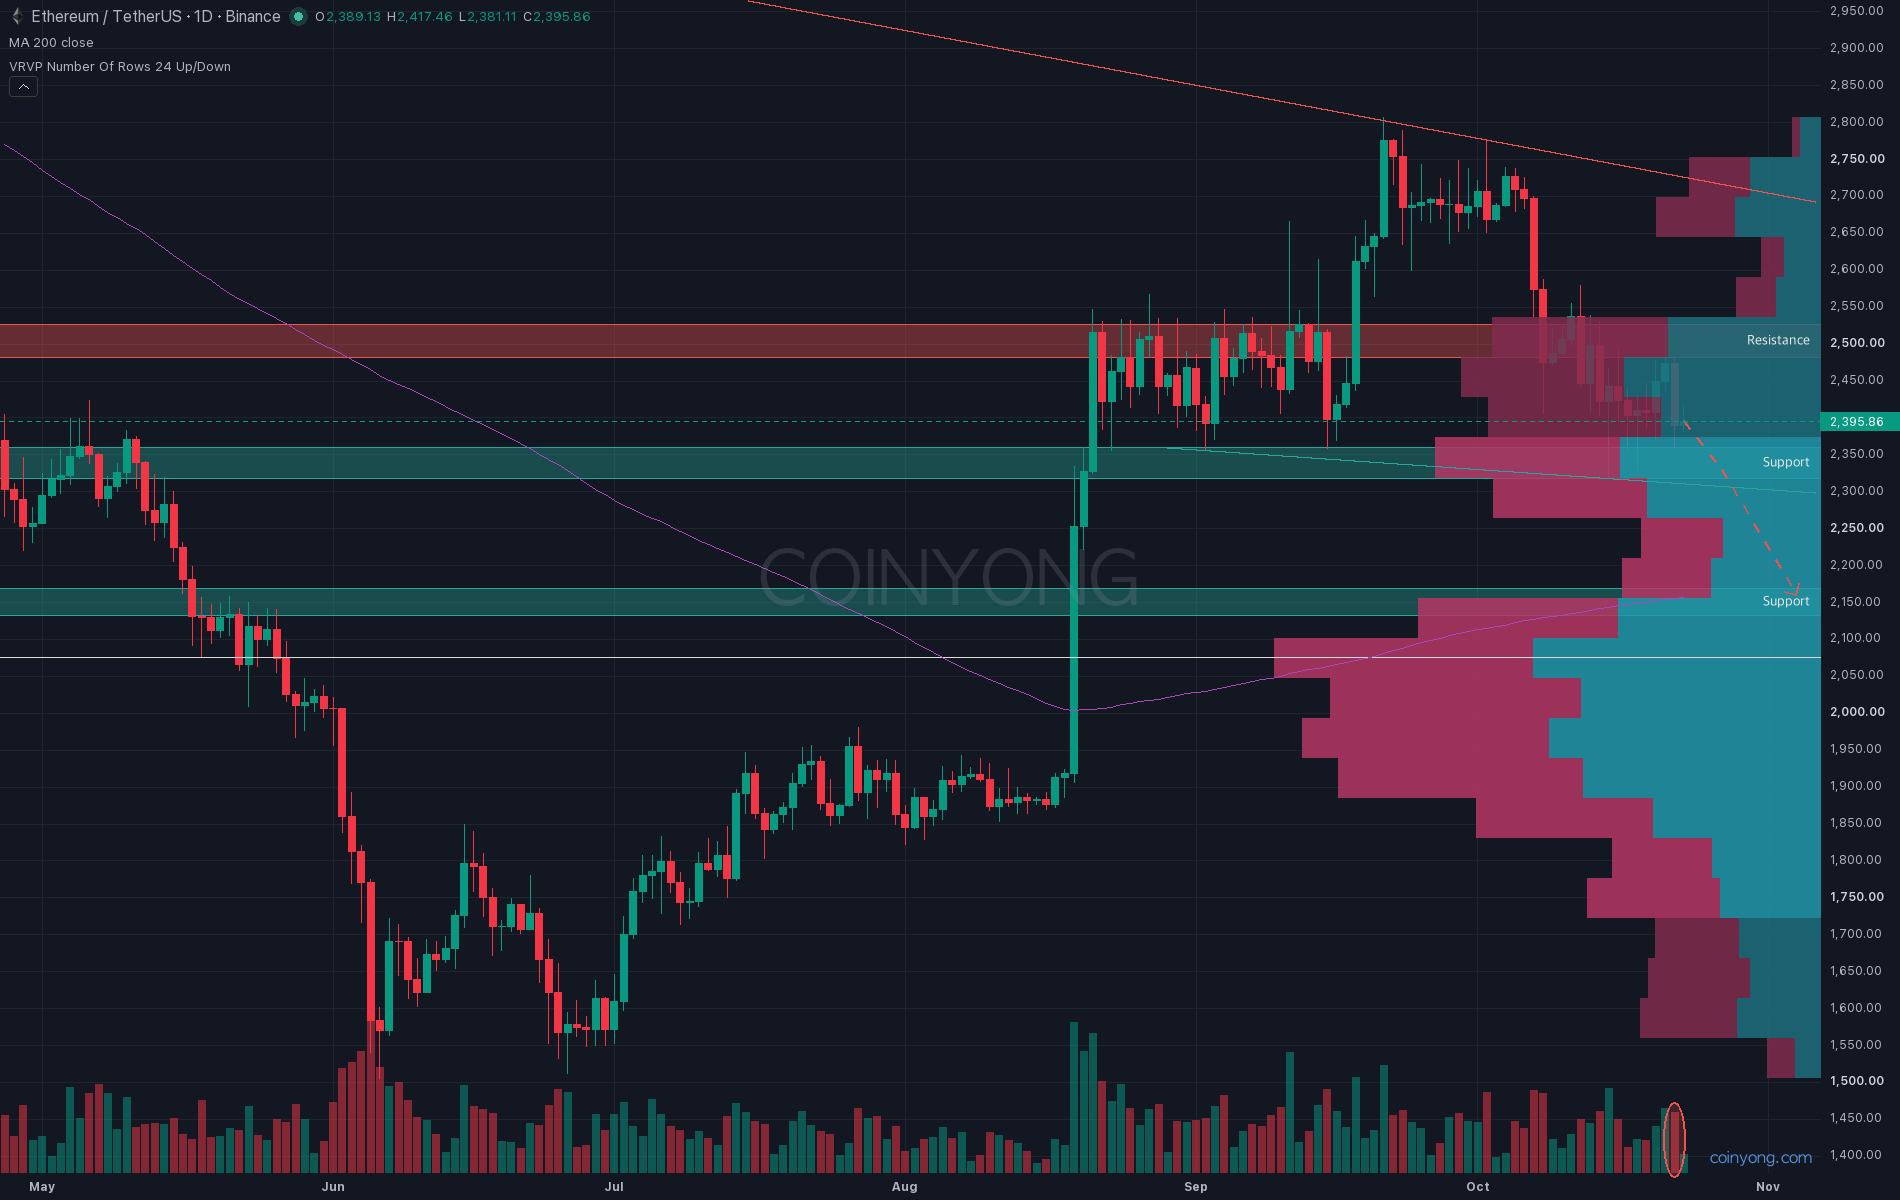
Ethereum has held a floor in the 2.3K area for more than a week. But every bounce has rolled over before 2.5K. Will the floor give way first, or will it hold again?
This is the Ethereum (ETH) daily chart. Since the September high at 2.8K, each high has come in lower: 2.78K, 2.58K, then 2.53K. A longer-term downtrend line from the high at the start of the year now runs near 2.73K and caps price from above. Meanwhile, the lows have held at almost the same level, 2.32–2.36K. Only the highs are coming down, so price keeps getting pushed toward the floor.
My last post leaned toward a pullback into the 2.36–2.4K zone, and the October 15 low reached 2,318. Since then, price has bounced three times from 2.32–2.36K.
What matters here is what sits below the floor. On the 260-day volume profile, 2.16–2.27K is a thin zone, with a heavy block of volume at 2.0–2.16K beneath it. The 200-day MA at 2.16K, the 20-week MA at 2.17K, and the halfway point of the rally from the June low to the September high (2.16K) all sit at the top of that block. If the floor goes, there isn't much in between for price to pause.
The broader market isn't helping ETH either. Bitcoin dominance is holding above 60%, and Ethereum has underperformed Bitcoin over the past week. Yesterday it fell more than 3% along with Bitcoin.
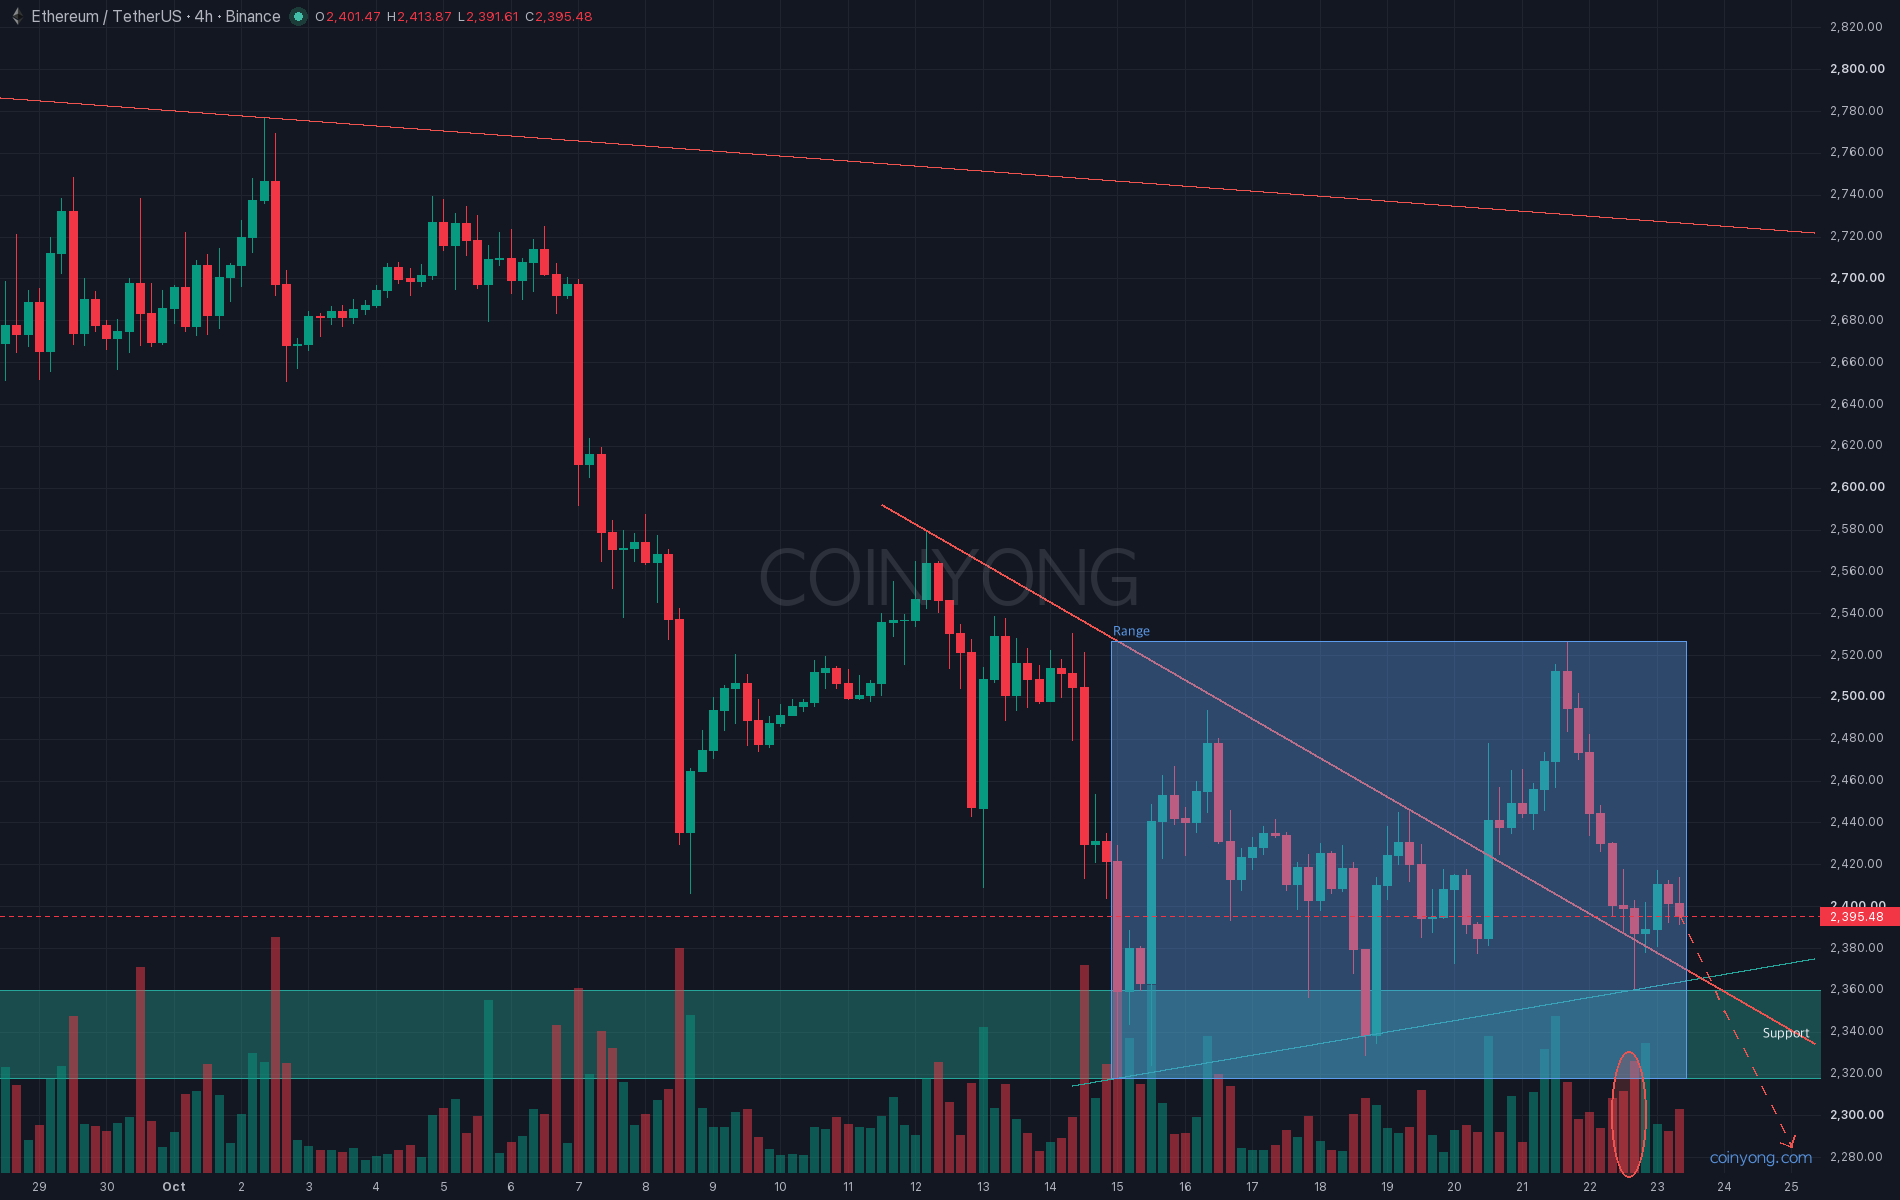
This is the ETH 4-hour chart. Since last Thursday (the 15th), price has been moving inside a 2.32–2.53K range. On Tuesday it broke above the 4-hour downtrend line connecting the October highs. That bounce was rejected at the top of the range at 2.53K, and Thursday's bearish candle came with heavy volume. Price is now retesting 2.36–2.37K, where that broken downtrend line meets the short rising line connecting the lows.
Order flow favors the downside. Over the past week, orders sized between $100K and $1M recorded nearly $380 million in net selling, while only orders between $1K and $100K showed net buying. The futures order book shows thick bids at 2.32–2.38K, but they thin out below 2.3K. Long liquidations are also clustered at 2.35–2.36K, so a break lower could accelerate quickly. That said, the daily RSI and OBV were actually higher at the October 15 low, so buyers supporting the floor haven't disappeared entirely.
In the end, highs keep getting lower and large orders are on the sell side. Personally, I'm leaning toward a break of the 2.32K floor and a test of the 2.13–2.17K zone below. A 4-hour close below the 2.36K line would be the first signal, and a close below 2.32K would mean the floor has broken. On the other hand, a daily close above 2.53K invalidates this view and puts a retest of the 2.73K downtrend line in play.
- Key resistance 2.48K - 2.53K (top of the range, where bounces stall first)
- First support 2.32K - 2.36K
- Next support 2.13K - 2.17K (200-day MA)
Until next week's FOMC meeting, the thing to watch is whether 2.32K holds on a daily closing basis.
 BTC
 SOL