Will Chainlink's $11 Support Hold Again?
 Coinyong
 LINK
LINK
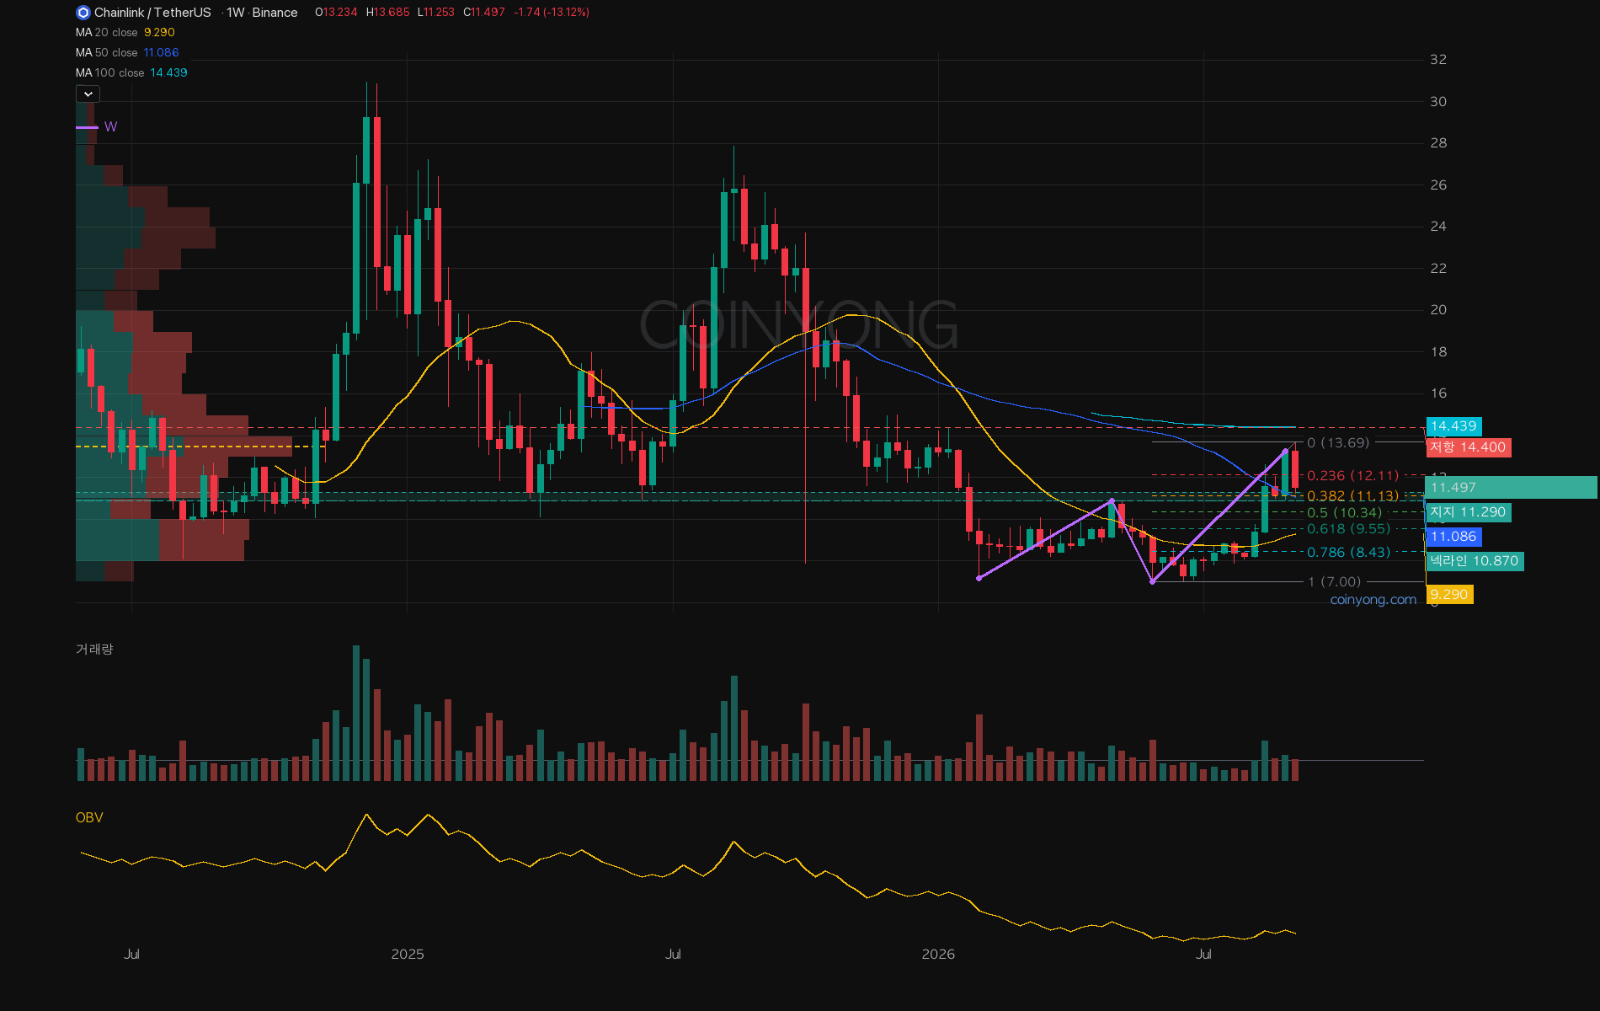
Chainlink (LINK) rallied to $13.685 on September 7 before closing the September 12 daily candle at $11.508. Down more than 13% in a week, its drop stood out even among top-cap alts.
On the weekly, it bottomed twice near $7 in February and June this year and climbed from there. After clearing $10.87 resistance, it closed last week at $13.233, but this week it's back down near the 50-week MA at $11.09.
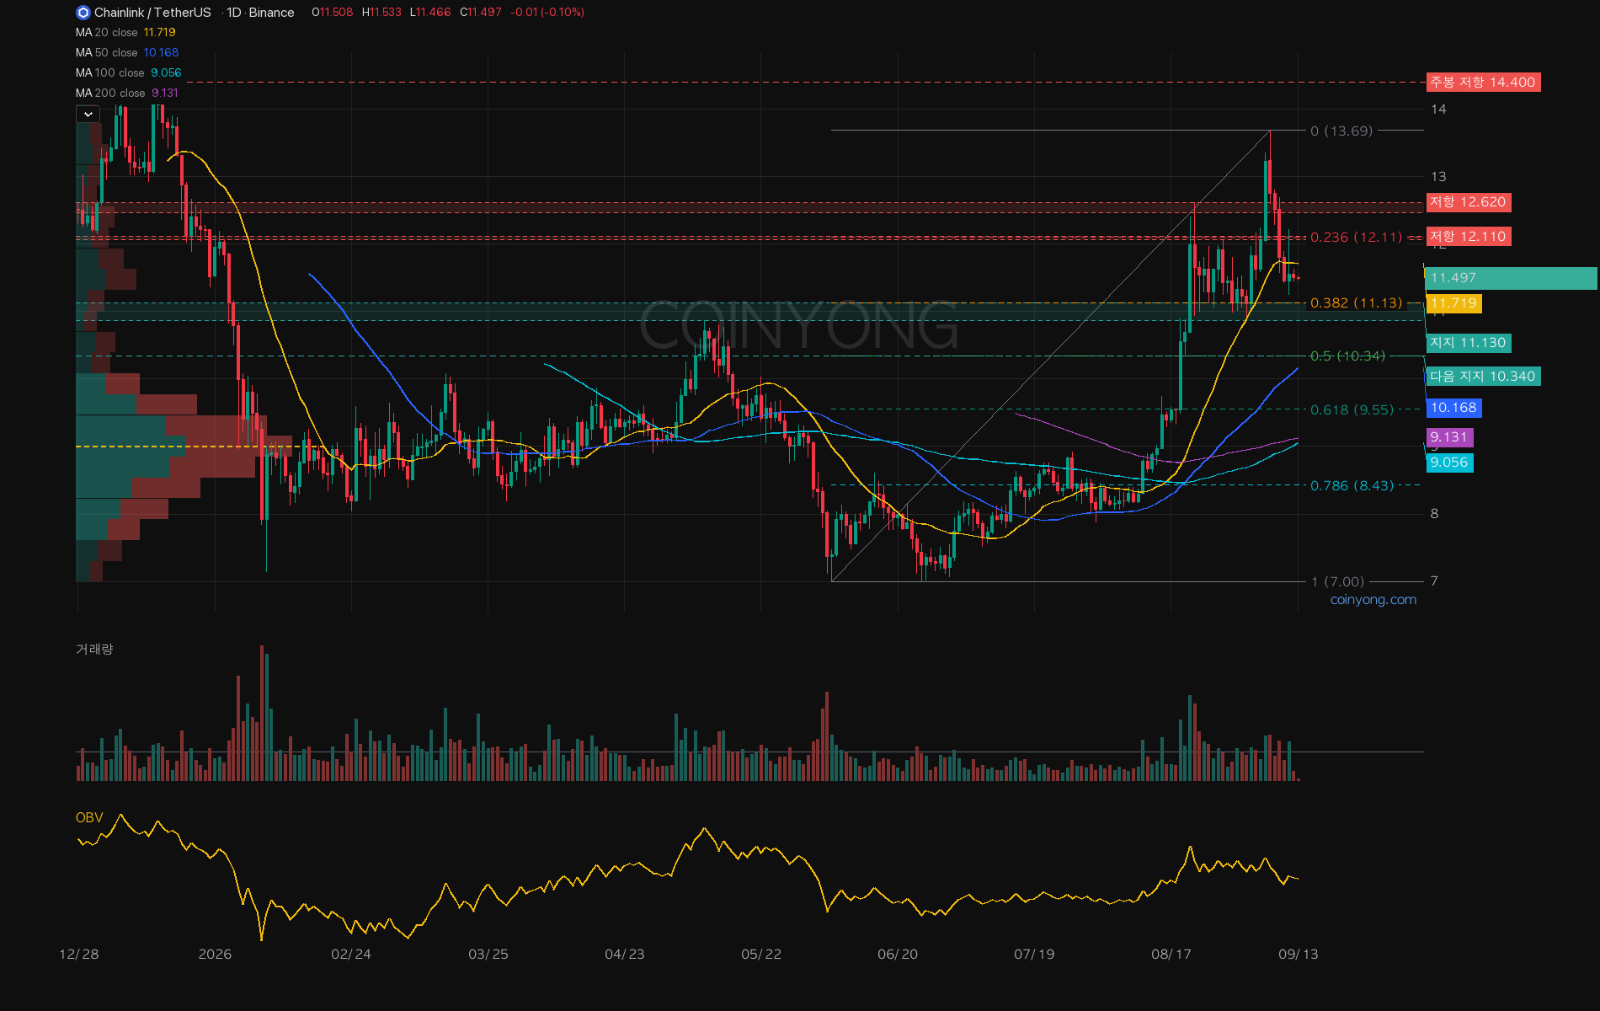
On the daily, the 38.2% Fib of the move from $7 to $13.685 is $11.13. The September 2 low of $10.908 and the old $10.87 resistance sit just below it. If it slides further, the next support should be viewed as the $10.87–11.13 zone.
The 4-hour is still putting in lower highs. The 50 MA is at $12.07, and on September 11 it reached $12.217 but left nothing but an upper wick. Until it clears $12.06–12.22, it's hard to say the short-term decline is over.
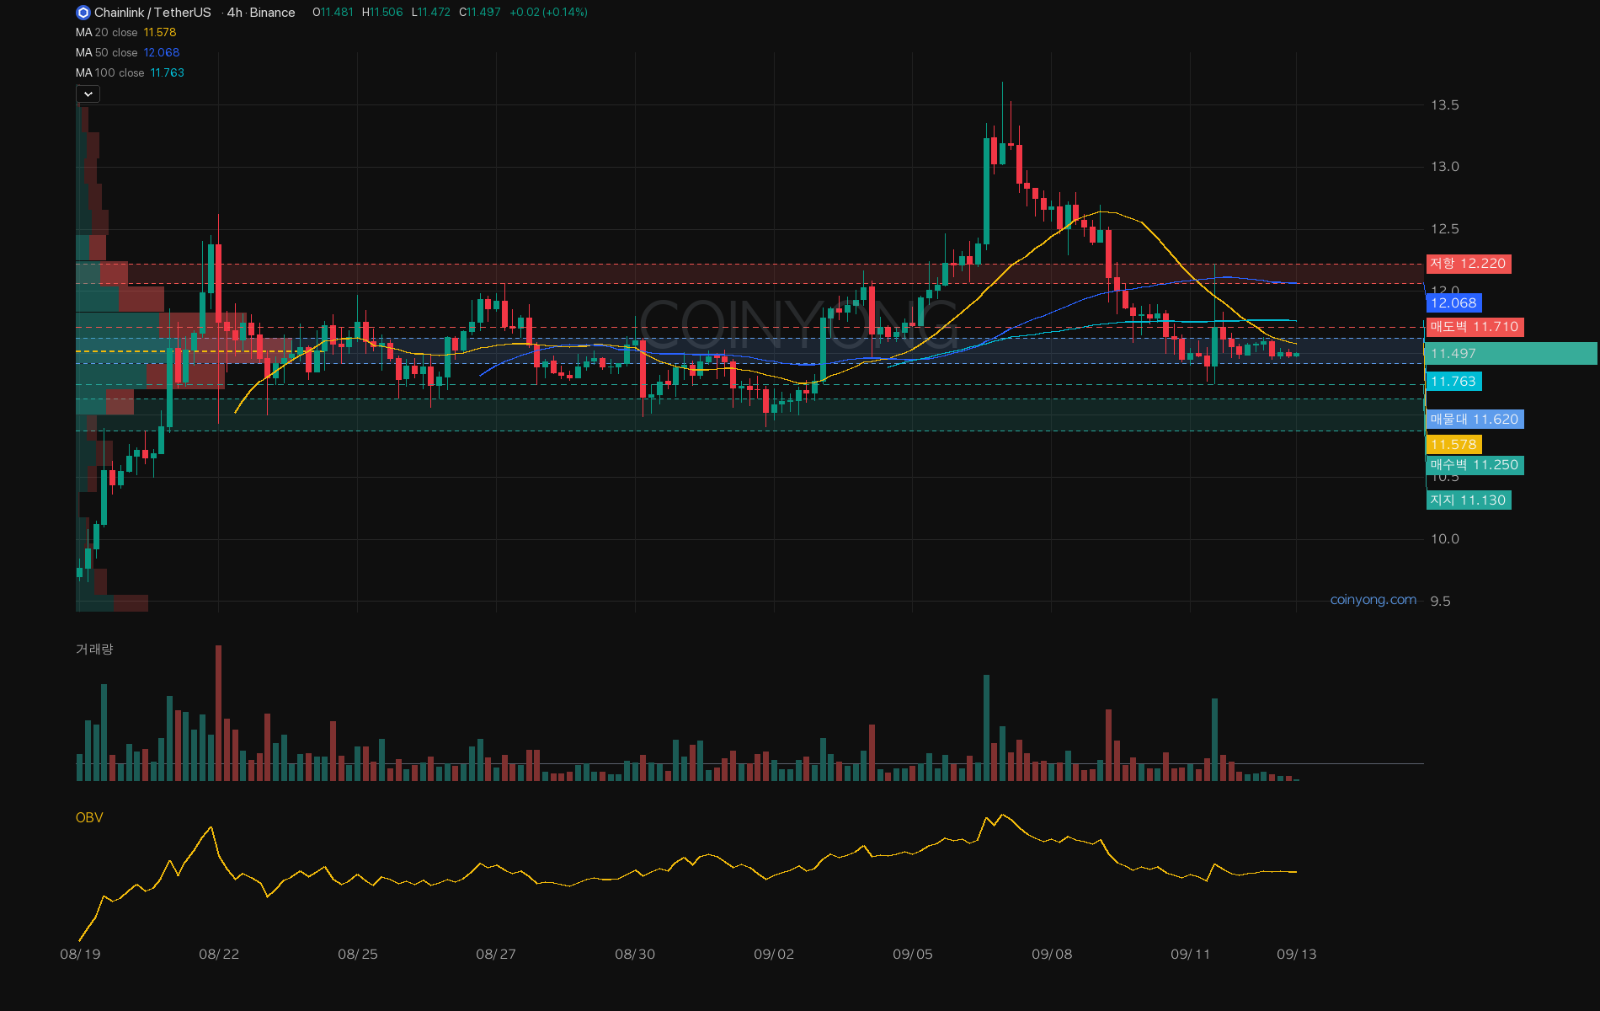
Over the last 30 days, the most volume has built up at $11.42–11.62. Widening to 80 days, volume nodes show up at $11.47–11.75 and $8.34. For now, the volume in the $11 range near the current price has to be worked through before the distant $8 area comes into play.
That doesn't mean a bottom is in right here, though. Volume on the last 4-hour candle was lighter than usual, and futures open interest has dropped nearly 7% over two days.
Price and open interest falling together looks more like existing leveraged positions being unwound than aggressive new shorts coming in. Large orders were still skewed to the sell side.
If it slips lower, $11.25 is the first level to watch. Failing to hold there puts the next support at $11.05–11.13. On the flip side, reclaiming $11.71 and then closing a 4-hour candle above $12.22 could extend the bounce to $12.47–12.62.
A daily close below $10.91 means the $11 support has broken. After that, leave room for $10.34 and $10.08.
It's Sunday ahead of the FOMC on the 15th–16th (US time), so this weekly candle is still in progress. In the end, whether it closes above $10.91 at the weekly close (00:00 UTC Monday) will decide this $11 support.
 ETH
ETH BTC
BTC