Bitcoin Prints a Third Red Weekly Candle — Will 80K Break After the FOMC?
 Coinyong
 MARKET
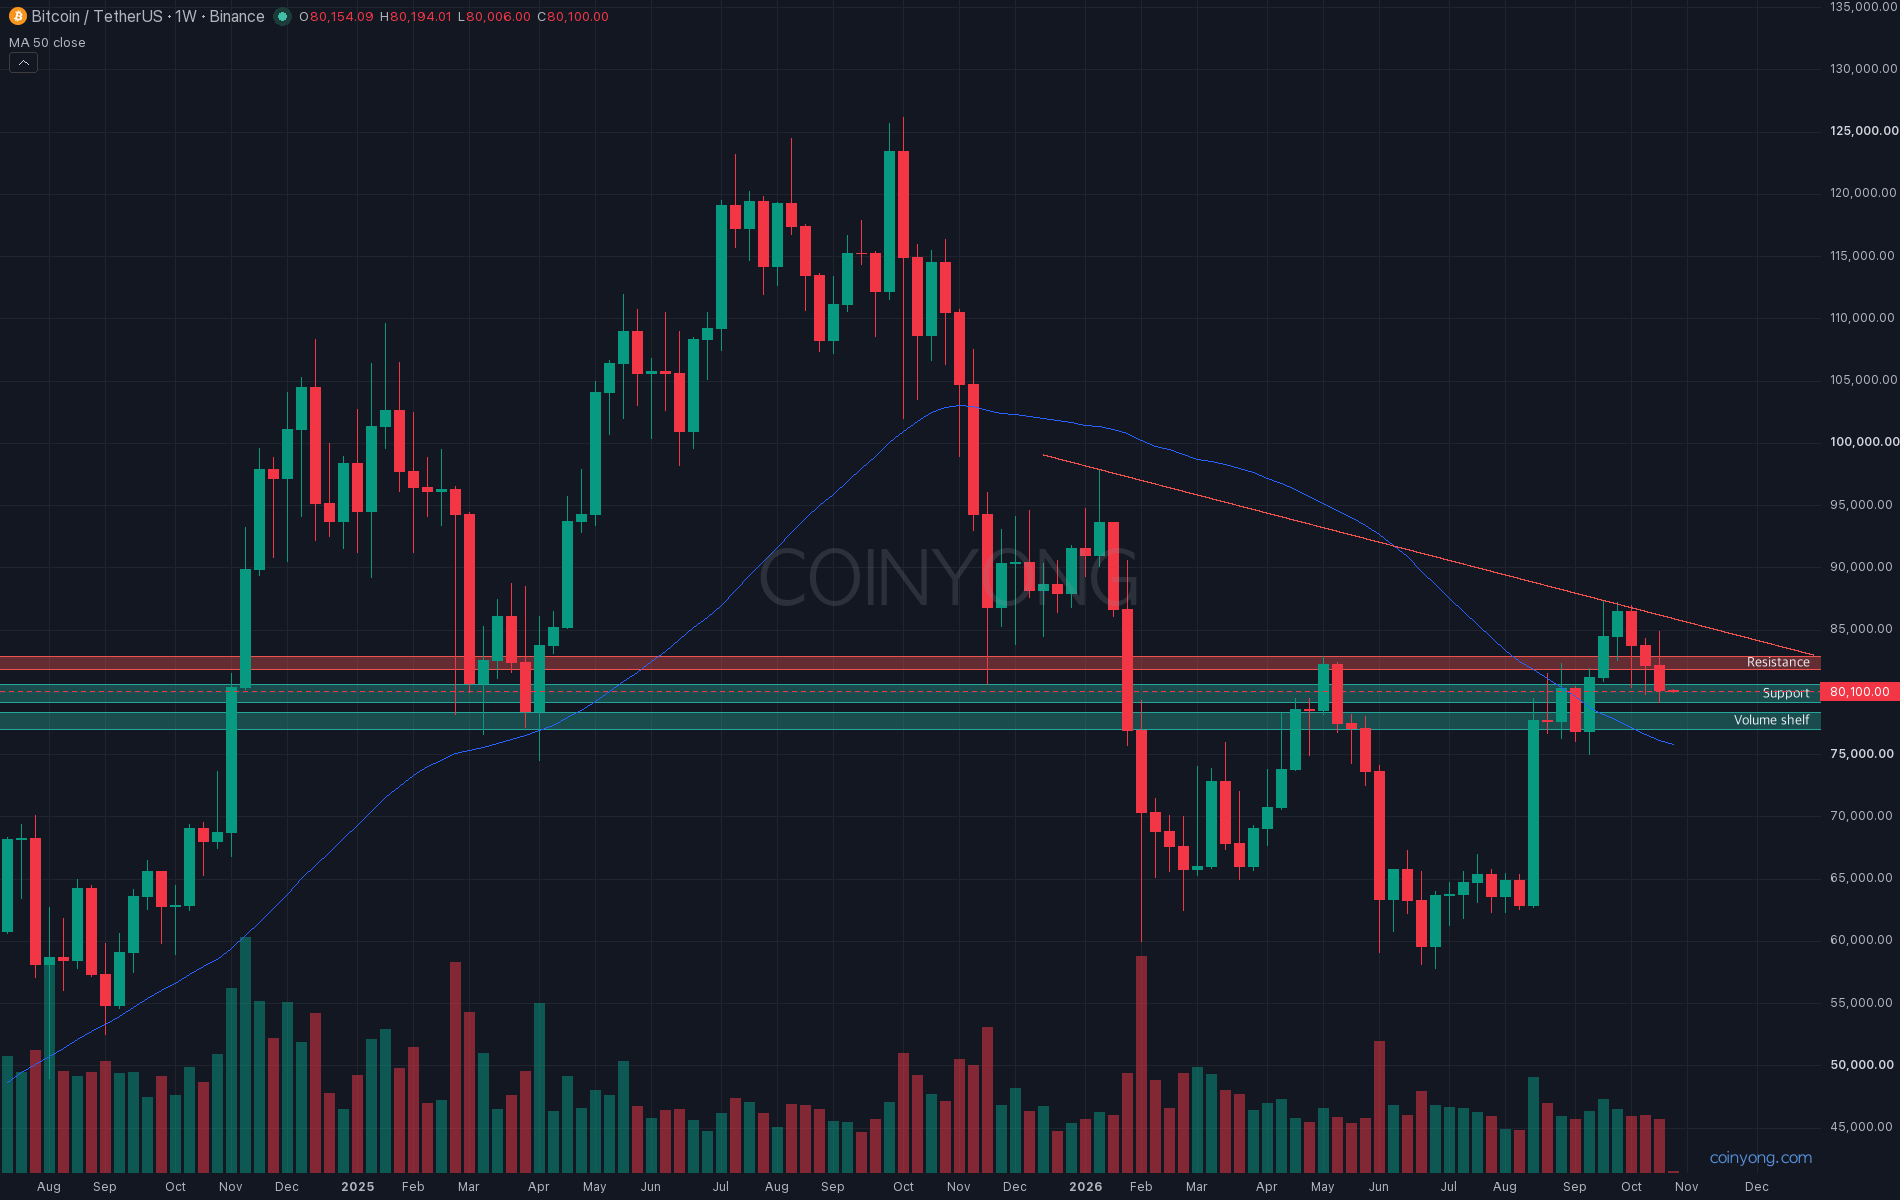
Bitcoin's weekly candle closed at 80.2K at 9 a.m. Seoul time today. The week opened at 82.1K, rallied to 84.9K, then slid to 79.2K, marking a third straight red weekly candle. With the FOMC decision due early Thursday Seoul time, can Bitcoin hold 80K?
This is the Bitcoin (BTC) weekly chart. The downtrend line connecting two highs, January's and September's, runs through 85.9K this week, and October's weekly highs kept rolling over near that line. Highs have slipped from 87.2K to 84.9K, and lows from 80.4K to 79.2K.
Price is now barely holding inside the 79.2–80.6K zone, where last November's weekly low and October's lows cluster. Below that sits the 77–78.4K volume shelf, the heaviest traded zone over the past 80 days, and further down the 50-week MA around 76K.
Last week's market update leaned toward a drop to 77–78K. Wednesday's daily candle closed at 84.1K, just above the 84K invalidation level, but price was pushed back to 81.4K the next day, and the low stopped at 79.2K without reaching the volume shelf. The 80.1–80.6K support from Friday's post gave way once on Saturday night as price dipped to 79.2K, but the weekly candle closed back inside it at 80.2K.
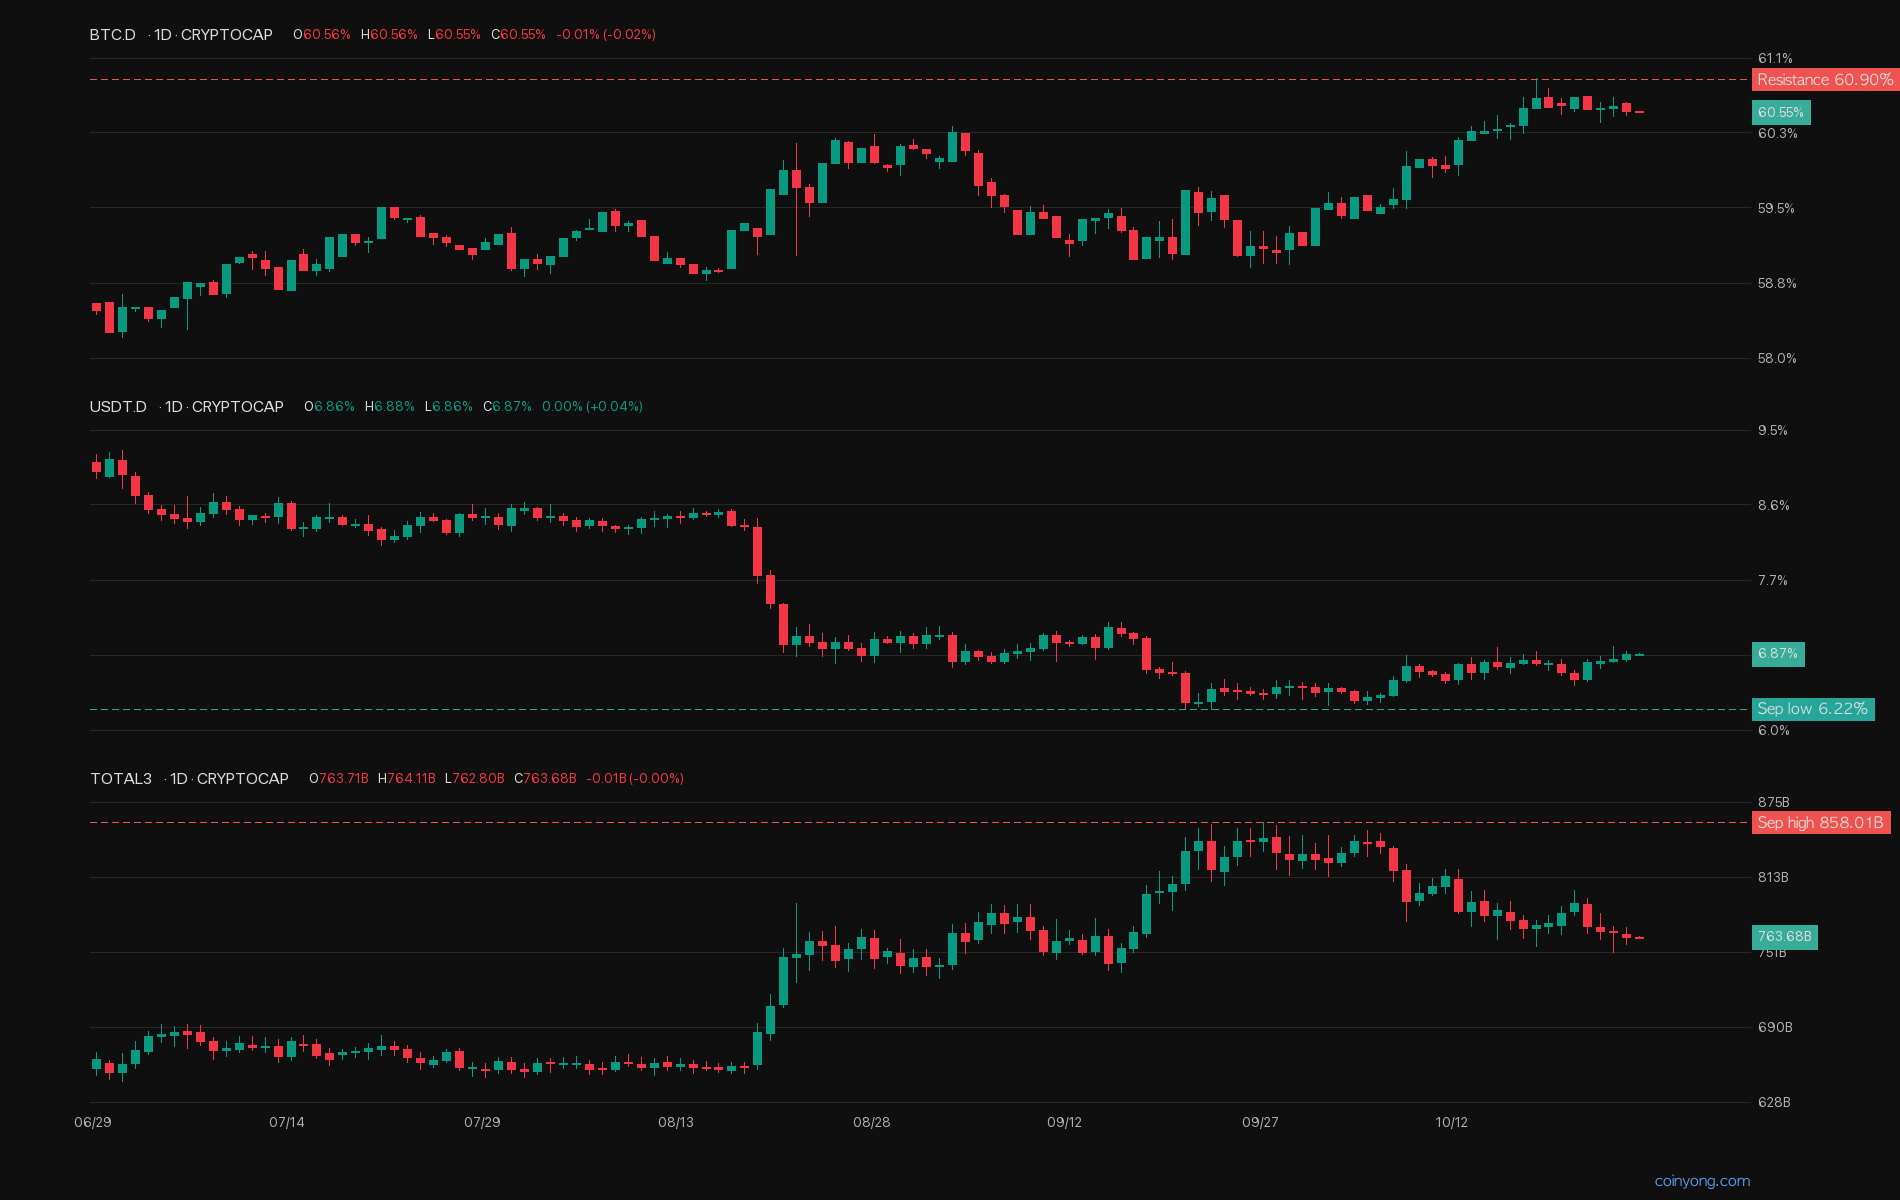
This chart shows Bitcoin dominance, USDT dominance, and altcoin market cap excluding BTC and ETH (TOTAL3). Over the previous two weeks, money leaving alts went into Bitcoin, but this week BTC dominance stalled below 60.9%. Instead, USDT dominance rose from 6.76% to 6.87%, extending a month-long climb from its September low, while altcoin market cap is down 11% from its September high.
What matters here is that money that had been rotating into Bitcoin moved into cash this week. Ethereum (ETH) also dropped to 2.28K on Saturday before closing at 2.33K, barely holding 2.3K, but it too posted a third straight red weekly candle.
Longs are still crowded in the futures market. Even as price fell, top traders' long share stayed high at 62%, and long liquidations are clustered just below at the 79K area and 77.4K, so one more push lower could trigger stacked liquidations and speed up the decline. Over the past day, orders sized between $100K and $1M recorded more than $140 million in net selling.
That said, there are reasons for a bounce. The daily Stoch RSI has fallen to 0, and while the October 15 low was lower than the October 8 low, RSI and OBV were actually higher. The largest bid wall on the futures order book is also sitting at 79.1K.
On the calendar: the FOMC rate decision at 3 a.m. Thursday Seoul time, PCE and the GDP advance estimate that evening, and month-end options expiry on Friday.
- Key resistance 81.8K - 82.9K (moving averages and the broken uptrend line; a daily close above invalidates the view)
- First support 79.2K - 80.6K
- Next support 77K - 78.4K (volume shelf)
- Below that, around 76K (50-week MA)
In the end, last week's bounce rolled over below the weekly downtrend line and resistance in the 82K area, and money is moving into cash not only from alts but from Bitcoin too. Personally, I'm leaning toward 79.2K giving way this week and a slide to the 77–78.4K volume shelf. On the other hand, a daily close above 82.9K invalidates this view and puts another run at the 85K-area downtrend line in play.
Until the FOMC, even if a bounce comes, the first thing to check is whether it can clear the 82K area.
 ETH
 BTC