SOL Looked Set to Lose $98, but It Was Just a Wick
 Coinyong
 SOL
SOL
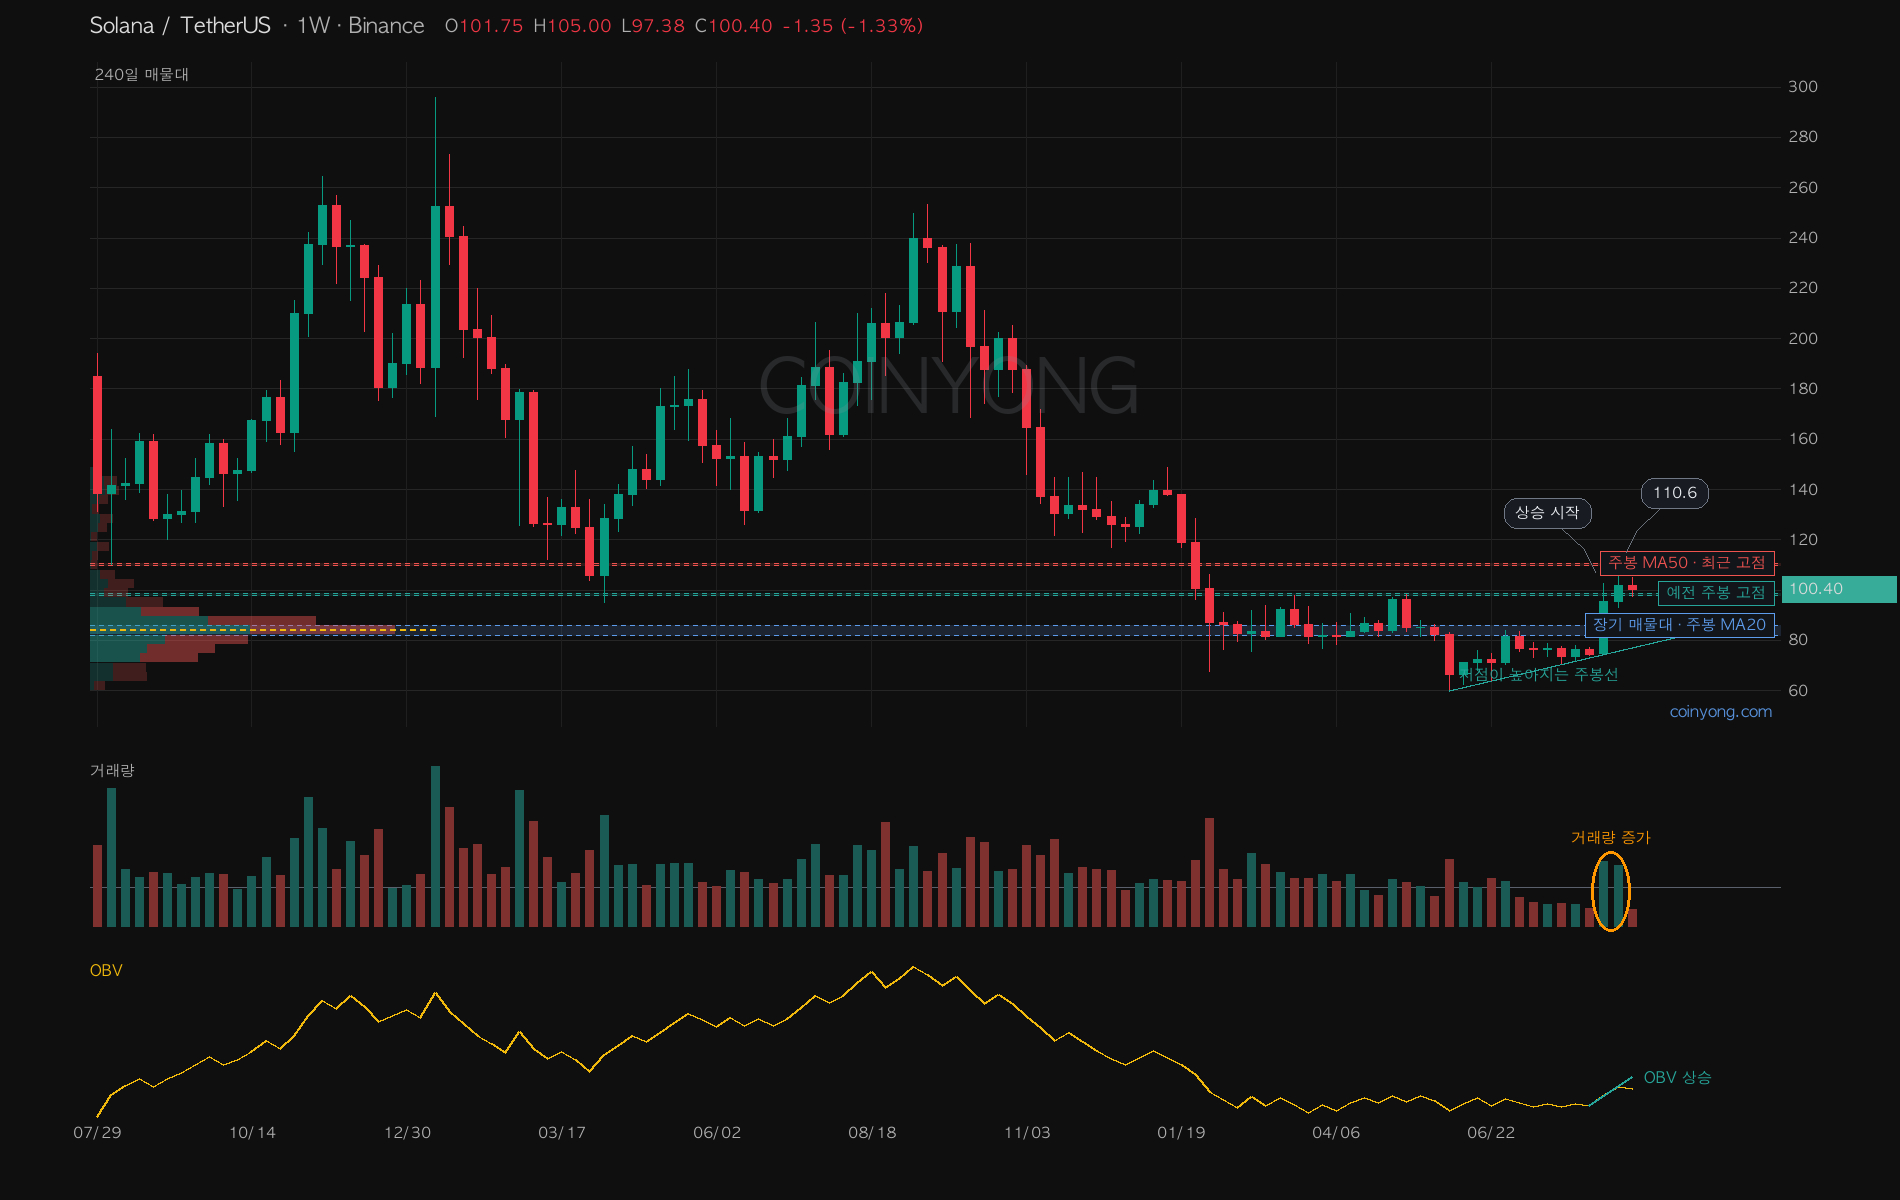
Solana topped at $110.6 on August 27 and slid back to $100, but the weekly structure is still printing higher lows.
It's holding above the uptrend line connecting $60.13 in June and $70.58 in July, and over the two weeks of August 17 and 24, volume and OBV rose together.
The more important level right now isn't $110.6 — it's $97.68–98.69.
That's where the March and May weekly highs sit, and it overlaps with $98.69, the 23.6% retracement of the rally from the June low to this latest high. On September 2, SOL wicked down to $97.38 before closing at $100.43.
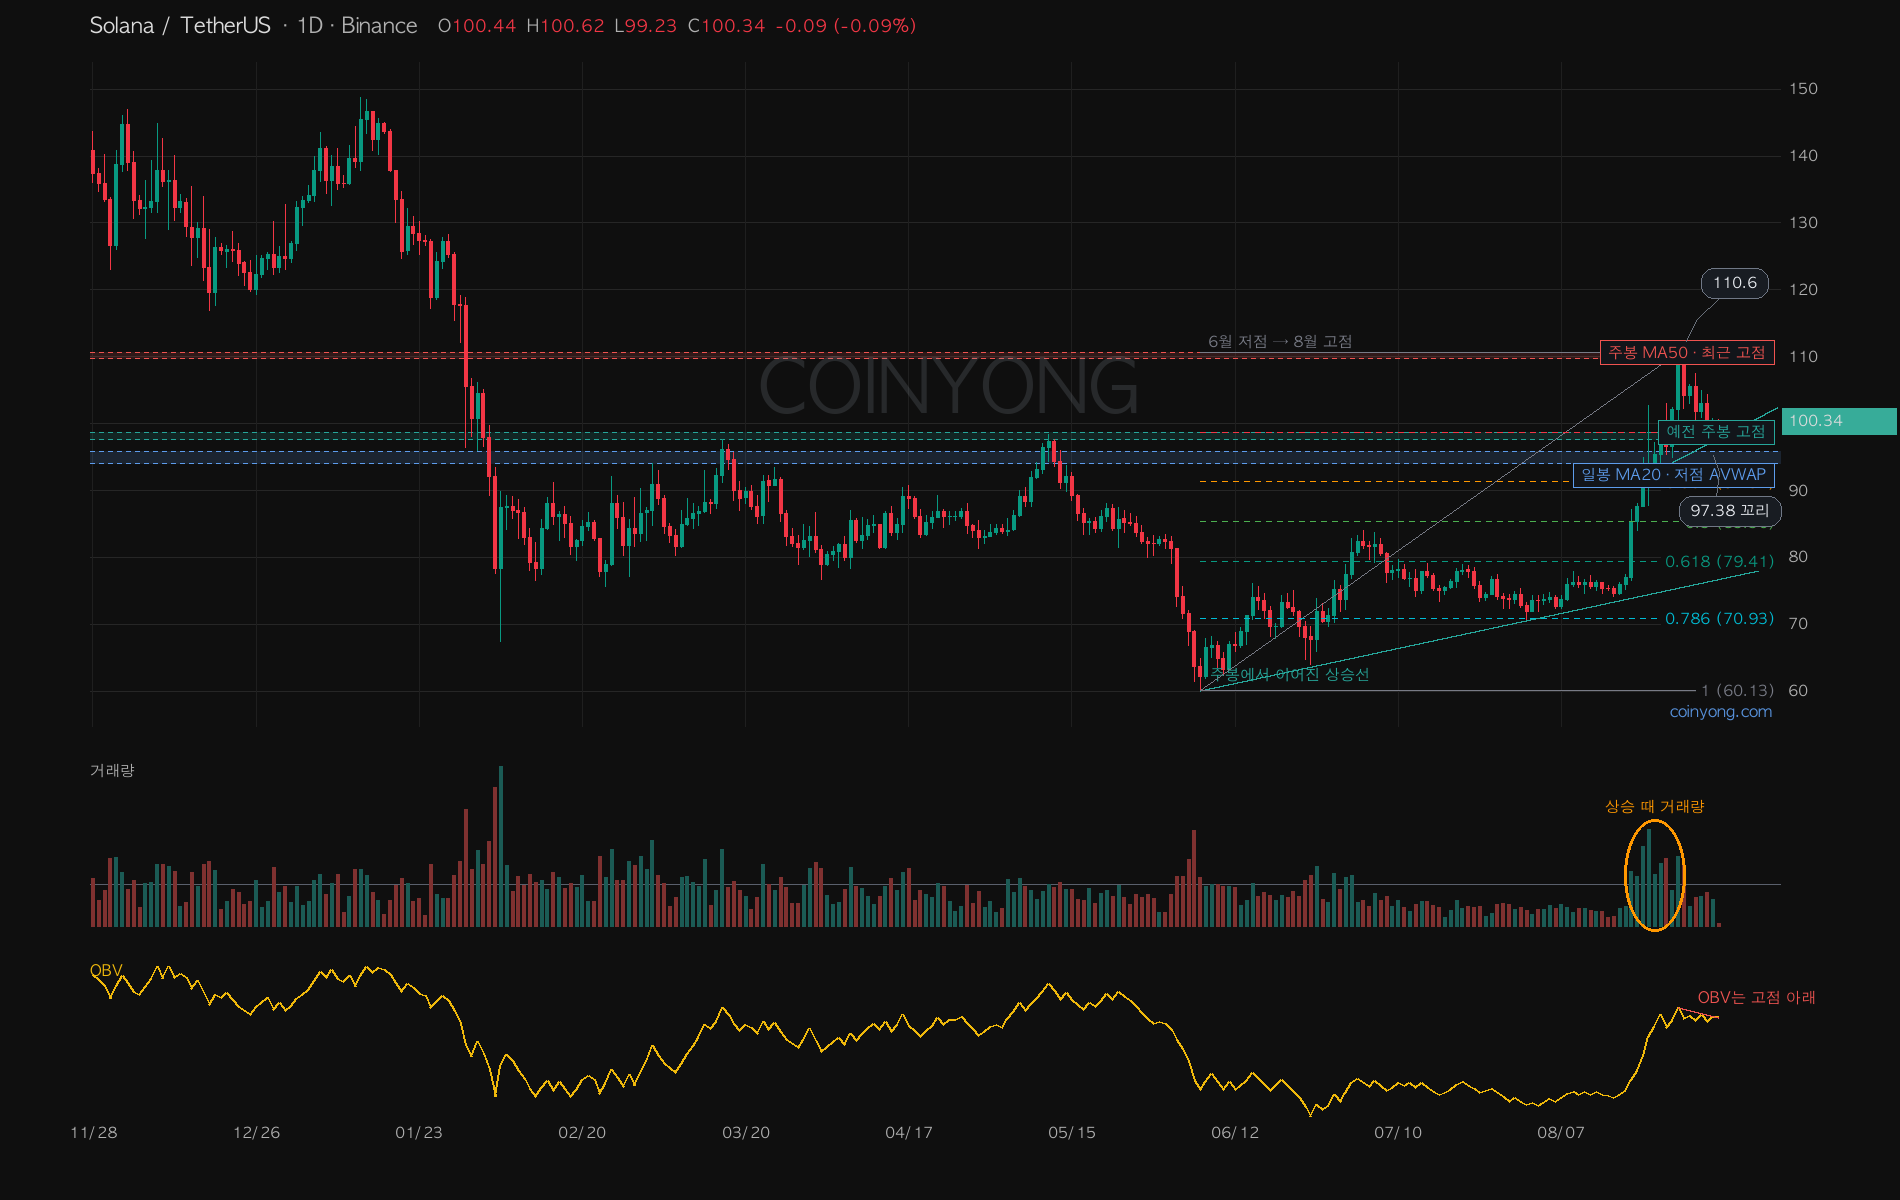
During the rally, 4 to 7 million SOL traded per day, but recent completed daily candles have stayed at 1.9 to 2.5 million SOL, and daily OBV is still below its August 27 high, so rebound strength hasn't been confirmed yet.
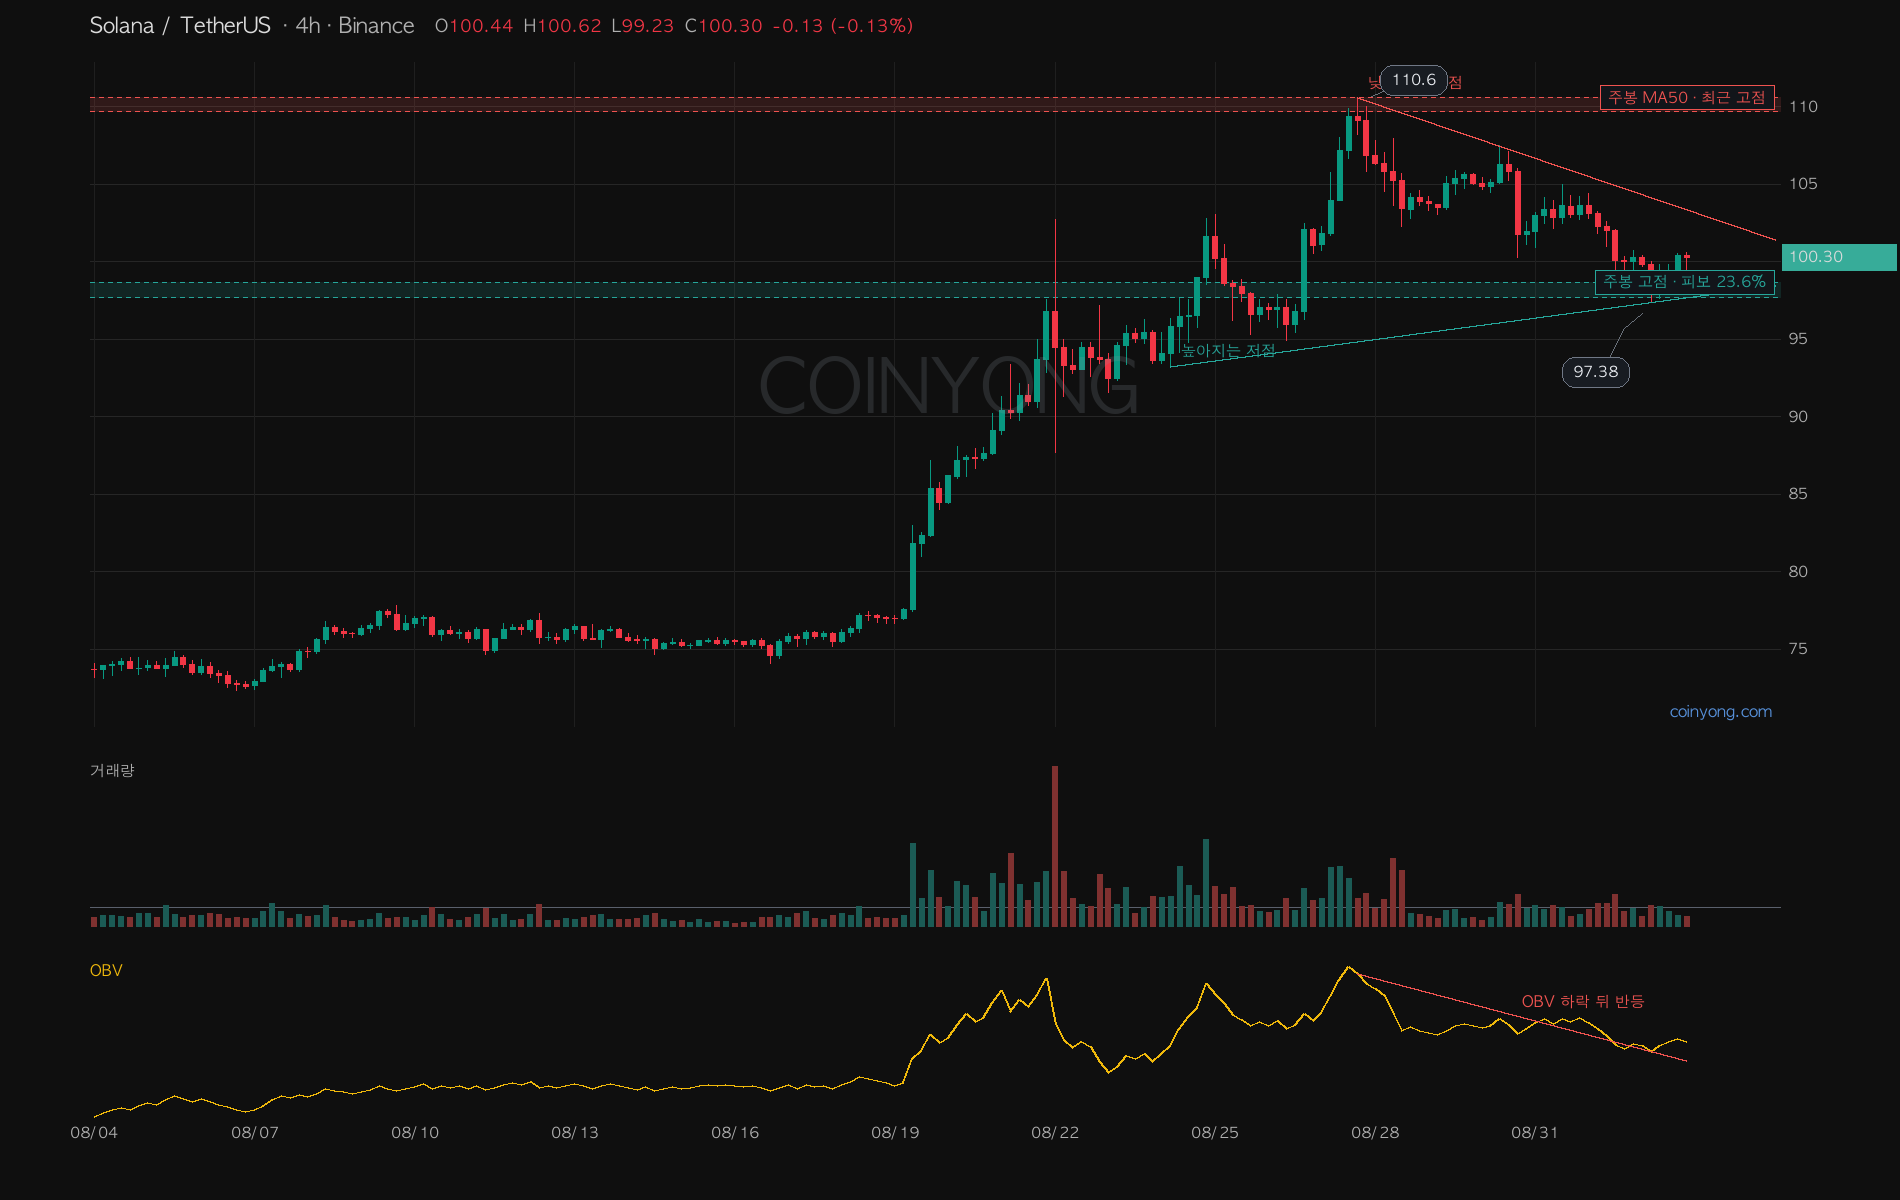
On the 4H, highs have been falling from $110.6 while lows have risen from $93.26 to $97.38, converging. ADX is at 25.8 with -DI above +DI, so the short-term flow is still corrective.
If SOL holds above $97.68 and closes above the descending line at $103–104, it can revisit $109.71–110.6. But if it gives up $97.68 on a daily close, we have to allow for a dip to the $95.91 average cost basis and the $94.05 MA20.
 ETH
ETH BTC
BTC LINK
LINK