Uniswap +45% in Five Days, but Rejected at 4.577 Three Times
 Coinyong
 UNI
UNI
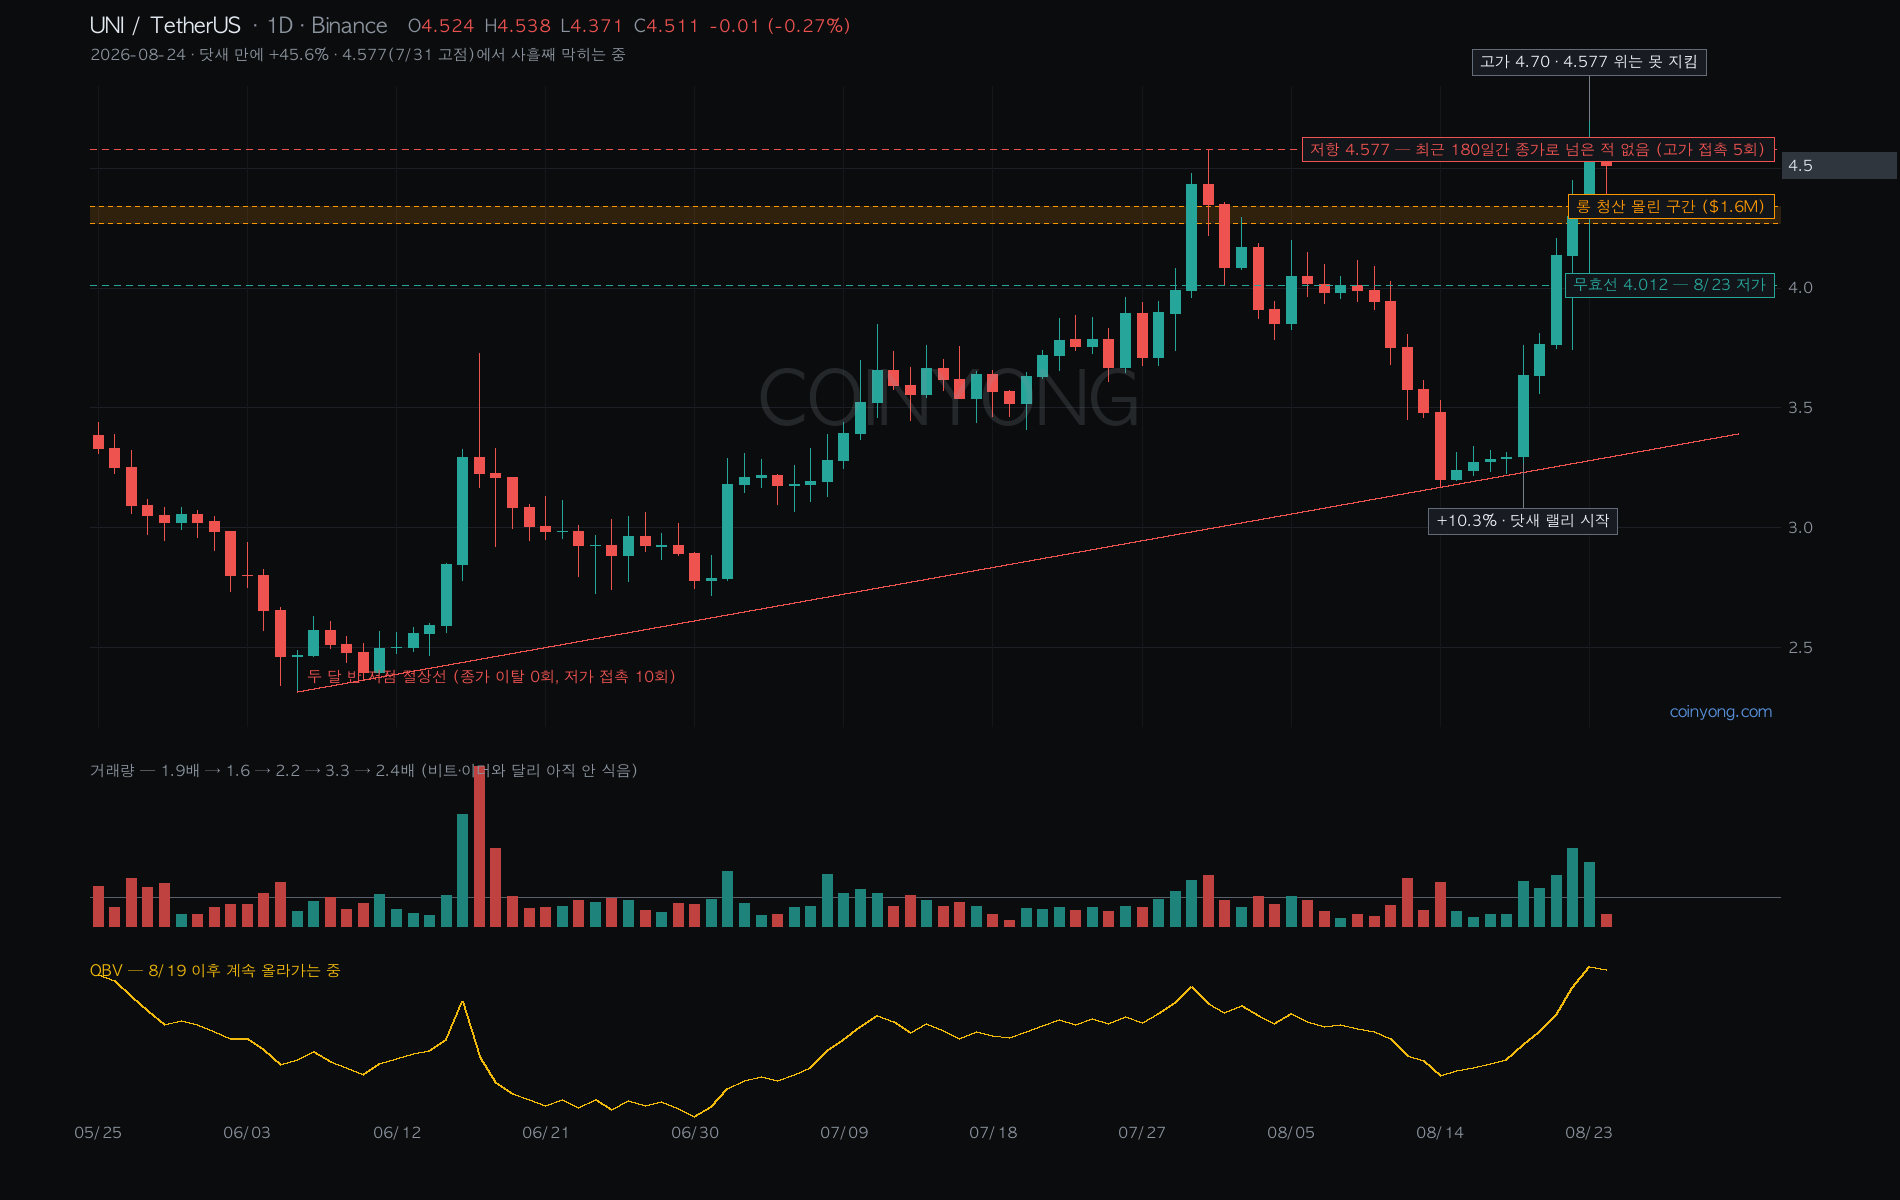
Uniswap is up 45% in five days. It was at 3.227 on 8/18 and reached 4.70 yesterday.
Every single day was strong: +10.3%, +3.5%, +9.9%, +3.9%, +5.3%. Five straight green days without a break, and today it's taking its first breather at -0.4%.
Rejected at 4.577 three times
The level it's stuck at right now is 4.577, the July 31 high.
Price hasn't closed above this line even once in the last 180 days. It has tagged it with a high five times (7/30, 7/31, and 8/22, 23, 24), but always closed below. Yesterday it spiked to 4.70 intraday and still finished at 4.523.
Same level, same outcome, three days running.
Volume hasn't cooled off yet
This is what sets it apart from BTC and ETH.
Relative to the 20-day average: 1.9x → 1.6 → 2.2 → 3.3 → 2.4x. If anything, it grew as the move went on. Over the same stretch BTC dropped from 2.9x to 1.0x, and ETH from 5.2x to 1.5x.
OBV has been rising all five days too. That means buyers haven't stepped away yet.
Empty overhead, with a caveat
Above 4.70, volume traded over the past six months is 0%. The current zone (4.40~4.80) holds just 3.3%, and the remaining 96% sits between 3.2 and 4.0.
On that alone you'd say "break it and it's wide open above," but stretch the window to one year and the story changes a bit. There's 19% sitting in the 5.5~6.6 zone. That's volume traded more than six months ago.
Nobody knows whether that old supply will still act as selling pressure. But to claim "it's completely empty above," you have to look at six months only; on a one-year view you can't say that. I'm factoring in the latter.
Downside: 4.01
$1.6M of liquidations are clustered at 4.27~4.34, about 4~5% below the current price. Small compared to BTC or ETH, but that's because UNI's market cap is small.
Below that is the 8/23 low at 4.012. A daily close below 4.012 and I'll treat the five-day rally as done for now.
There's also a line that has been lifting the lows for two and a half months. It connects the June 6 low (2.316) and the August 14 low (3.171); price has never closed below it, and the lows have touched it ten times. But that line is now at 3.295, 37% below the current price. It's not immediate support; it's for judging how far a pullback can go while staying inside the trend.
Notes
RSI is at 69. Above 70 is usually read as overheated, so it's just below. The 50-day MA has crossed above the 200-day.
On the order book, there's a sell wall at 4.54 and a thick bid at 4.09, each slightly outside the current range.
In short, it all comes down to whether it closes above 4.577. If it does, a zone with no supply for the past six months opens up; lose 4.012 and you have to leave room down to around 3.7. Brief intraday tags don't count either way.
Investment decisions are your own responsibility; this post is for reference only.
 ETH
ETH BTC
BTC LINK
LINK