Uniswap Breaking a 5-Year Downtrend Line?
 Coinyong
 UNI
UNI
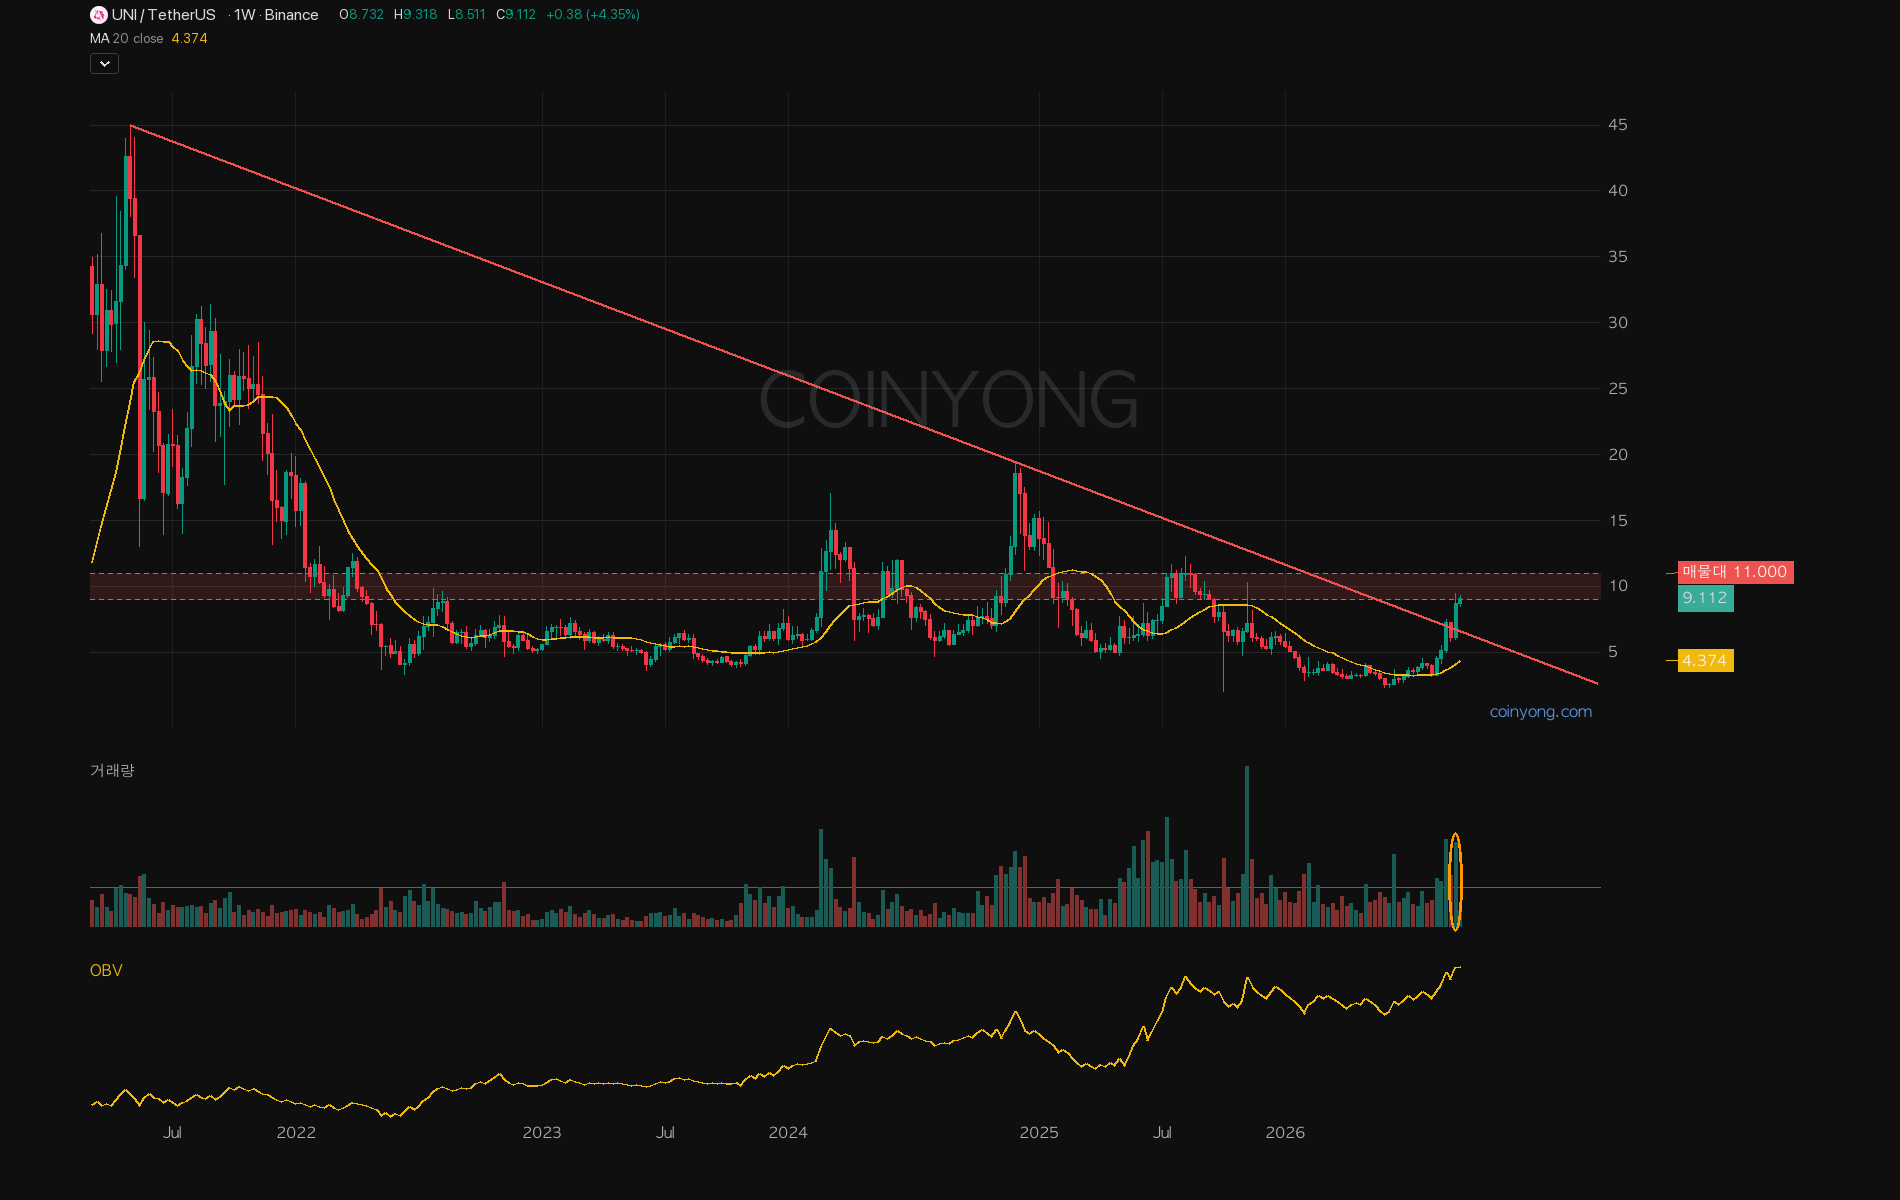
Uniswap (UNI) tripled in five weeks, from 3.17 in mid-August to 9.5 last week, rested for three days, and pushed back above 9 yesterday. That was the day Bitcoin broke through the 82850 wall and ran to 86000, so alts went along with it, and UNI is now at 9.1.
This rally started after UNI spent half a year, from February to August, building a base between 2 and 4.6, then broke out above it in late August. That same week it also cleared the five-year downtrend line running from the 2021 high of 45 to the 2024 high of 19.5. What's left overhead now is supply between 9 and 11. That's where it held for months in spring–summer 2024 and again last summer before collapsing both times, and last November's spike also topped out at 10.3. At 9.1, price has just stepped inside that supply zone.
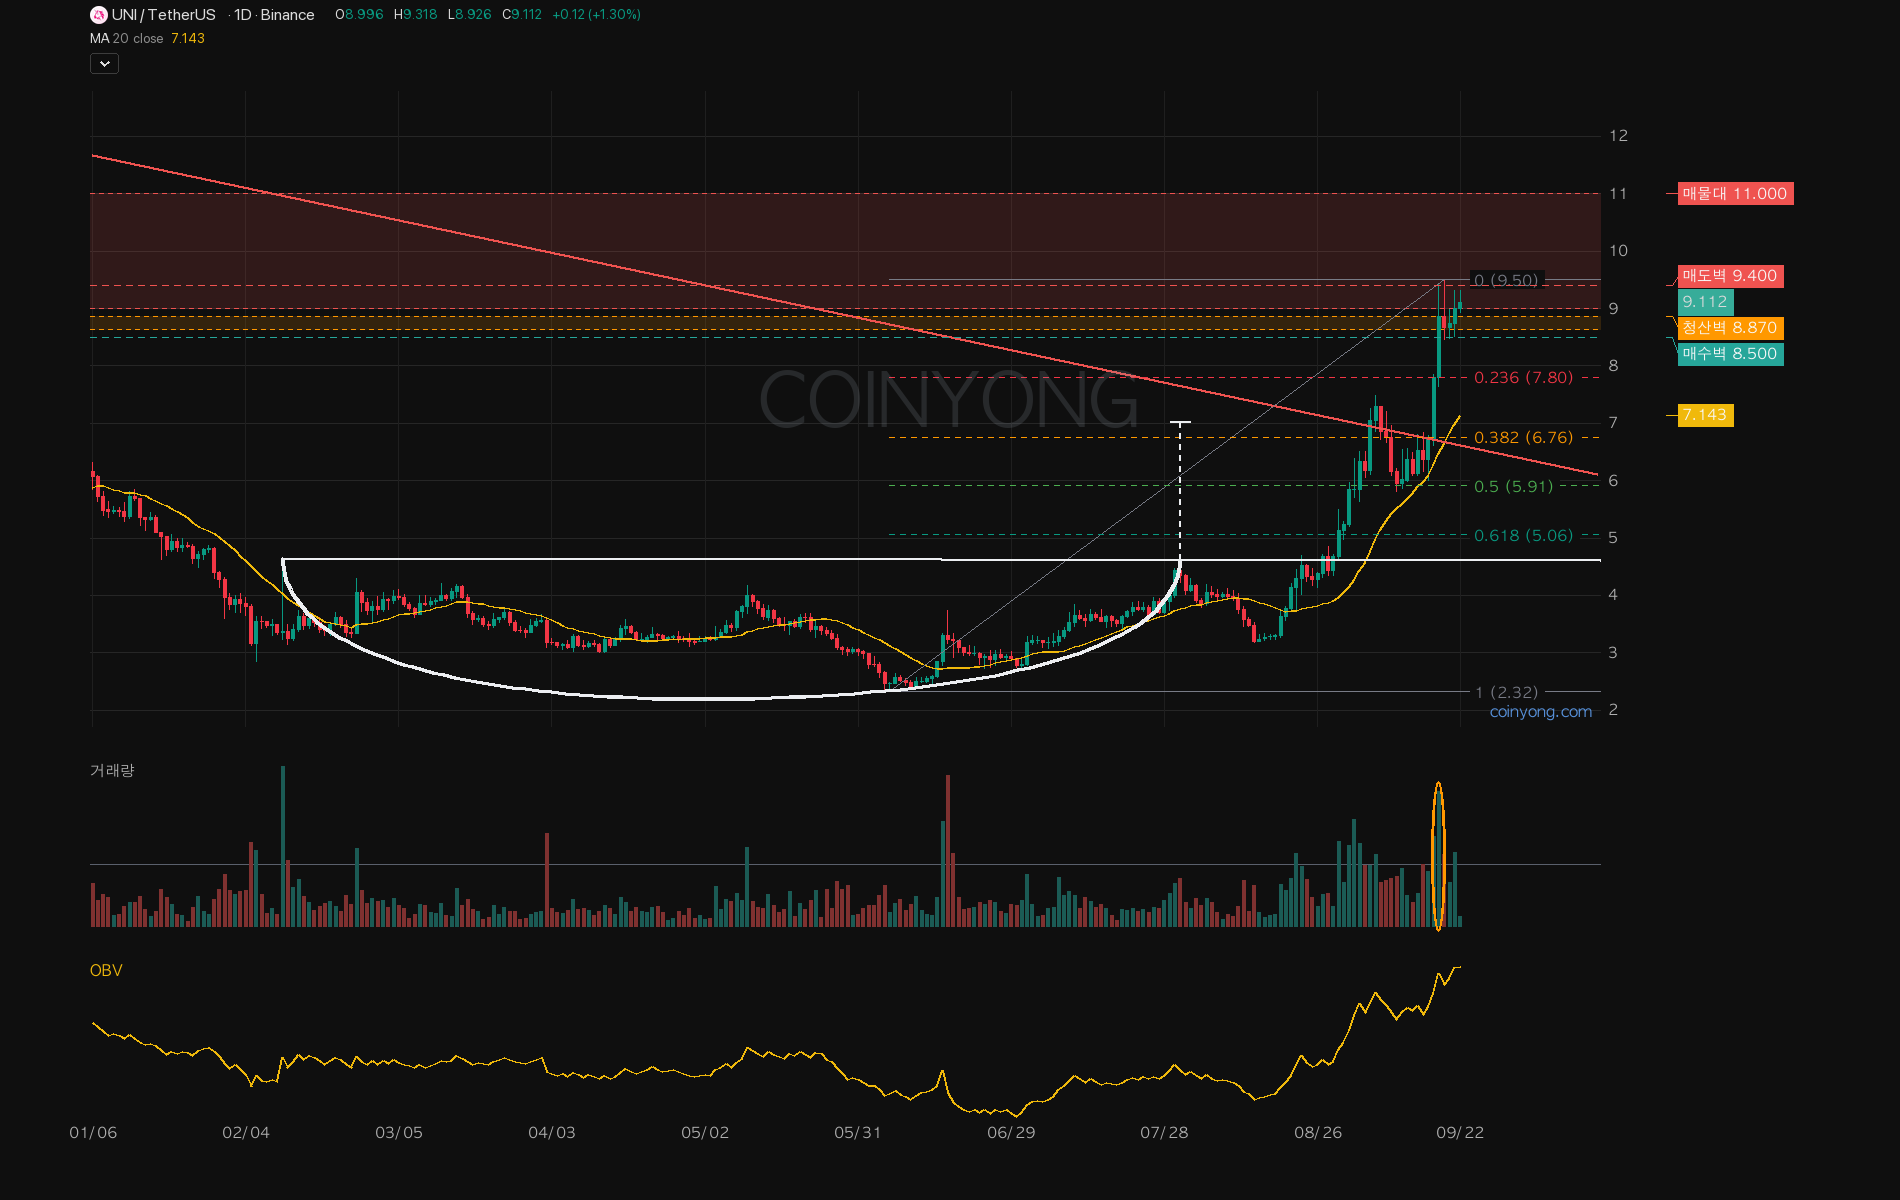
The white cup on the chart above is that base. Since breaking out of the cup on August 27, there's been only one pullback, to 5.81 on September 10. Yesterday closed at 9.0, above last week's range, and measuring the retracement from the June bottom to 9.5, 7.8 is the first level, with the 20-day MA at 7.14 below that.
There's a sell wall right above at 9.4, and below, long liquidations are clustered between 8.64 and 8.87. Under that, thick bids are stacked at 8.5. Volume yesterday was a bit above normal, but large orders are still on the sell side, so if 9.5 isn't cleared on a close, price could shake down to the liquidation zone once.
A big driver of this run was the SEC deciding to exempt trading of tokenized stocks in permissioned pools from exchange registration. Uniswap already has those pools in place, and its UNI-burning fee mechanism has also gone live. Last night saw ₩1 trillion in Bitcoin liquidations and the Fear & Greed Index climbed to 78, so sentiment is firmly in greed territory.
In the end, it comes down to whether it clears last week's high of 9.5. If the daily closes above it, there's nothing in the way up to last November's wick at 10.3, so it could get there quickly; if not, the usual pattern is a shakeout down to the liquidation cluster at 8.64 before it climbs back. With Bitcoin over its wall and alt market cap at new highs, upside first is more likely than downside. A daily close below 8.46 means this attempt has failed, and 7.8 or the 20-day MA has to stay on the table. Still, as long as price is above the September 10 low of 5.81, the bigger trend hasn't broken.
This is a coin that tagged 10.3 last November and was cut in half within three weeks, so hopefully this time it holds and keeps climbing.
 ETH
ETH BTC
BTC LINK
LINK