XRP Slips Back Below Its 5-Month Downtrend Line
 Coinyong
 XRP
XRP
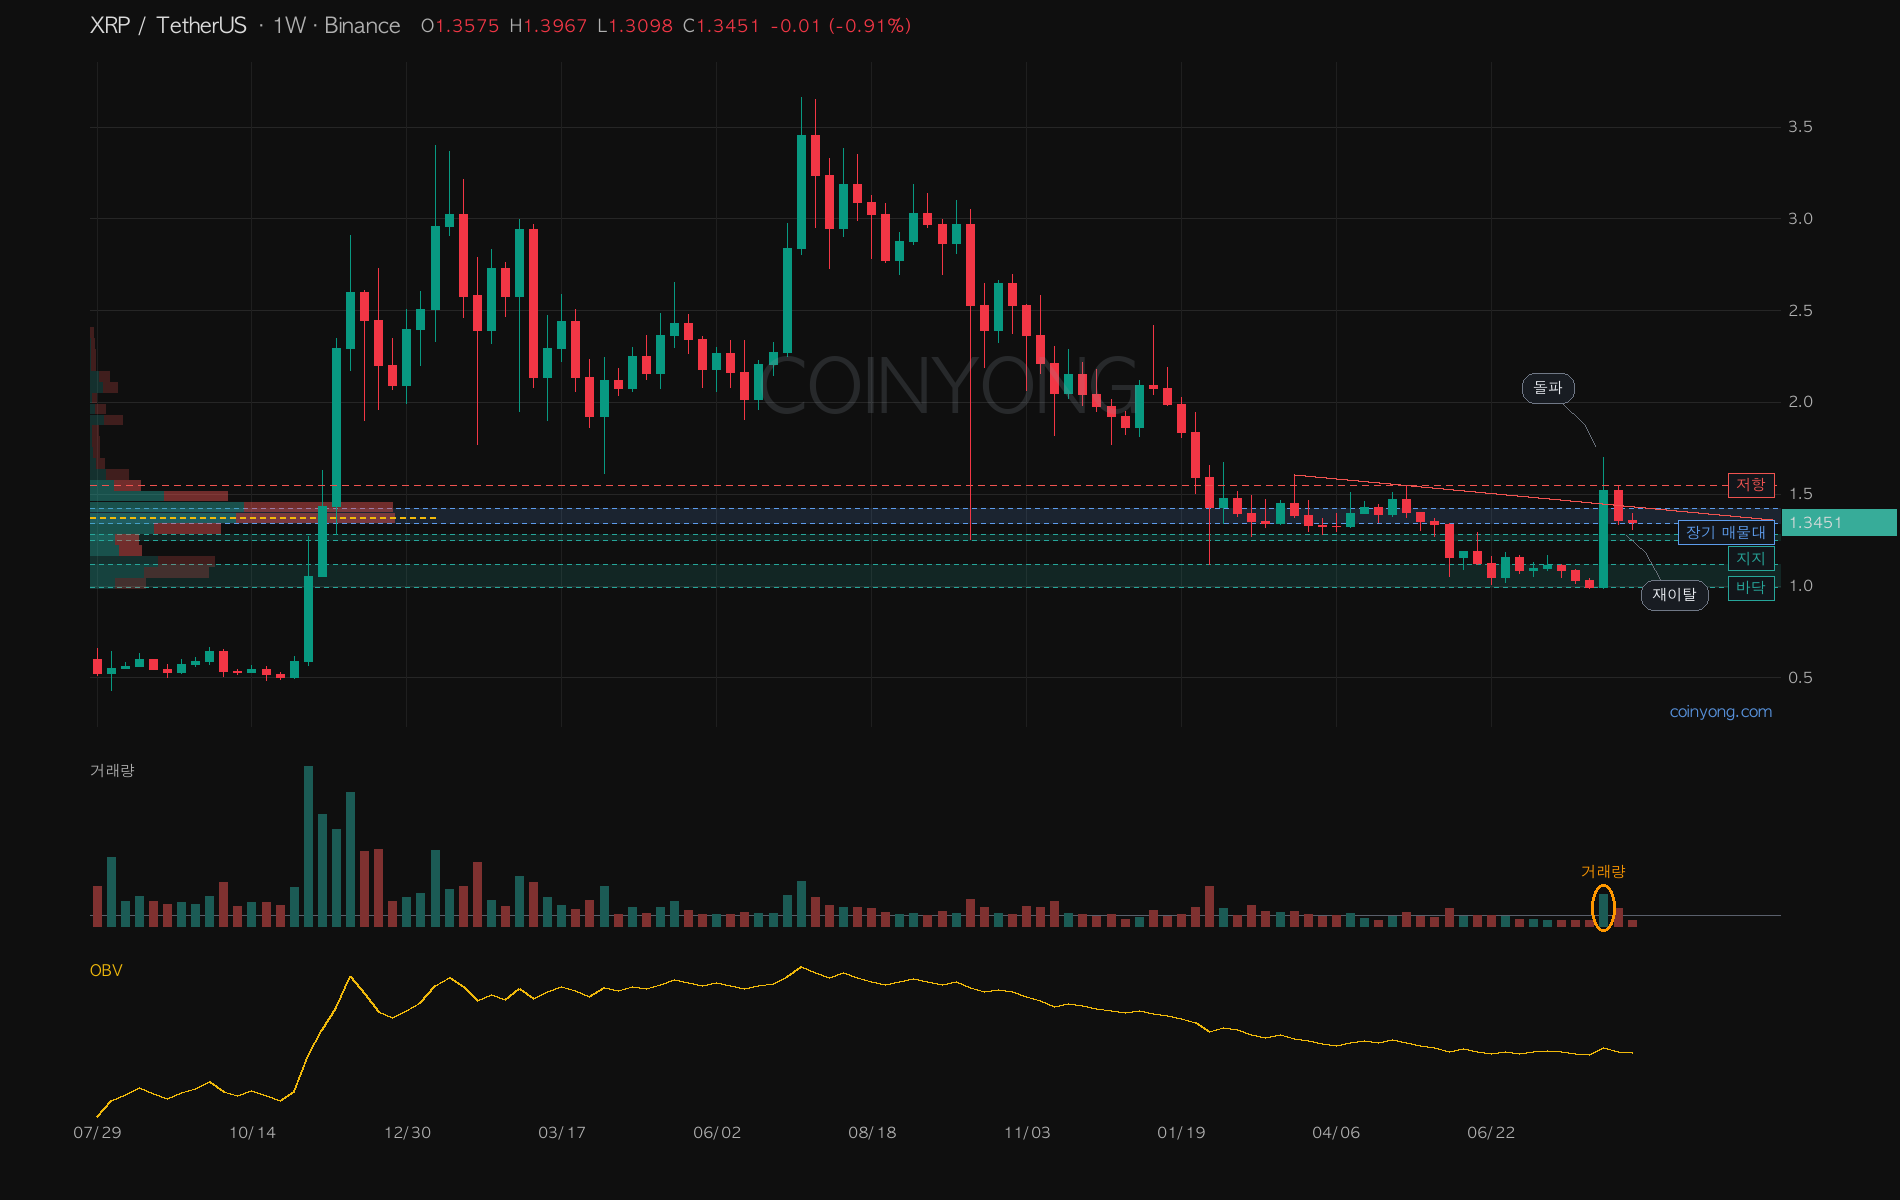
XRP broke above its five-month downtrend line in the third week of August, but the following week's close slipped back below the line, so that breakout failed.
The September 2 close was also $1.3511, so it hasn't reclaimed $1.43, where the downtrend line currently runs.
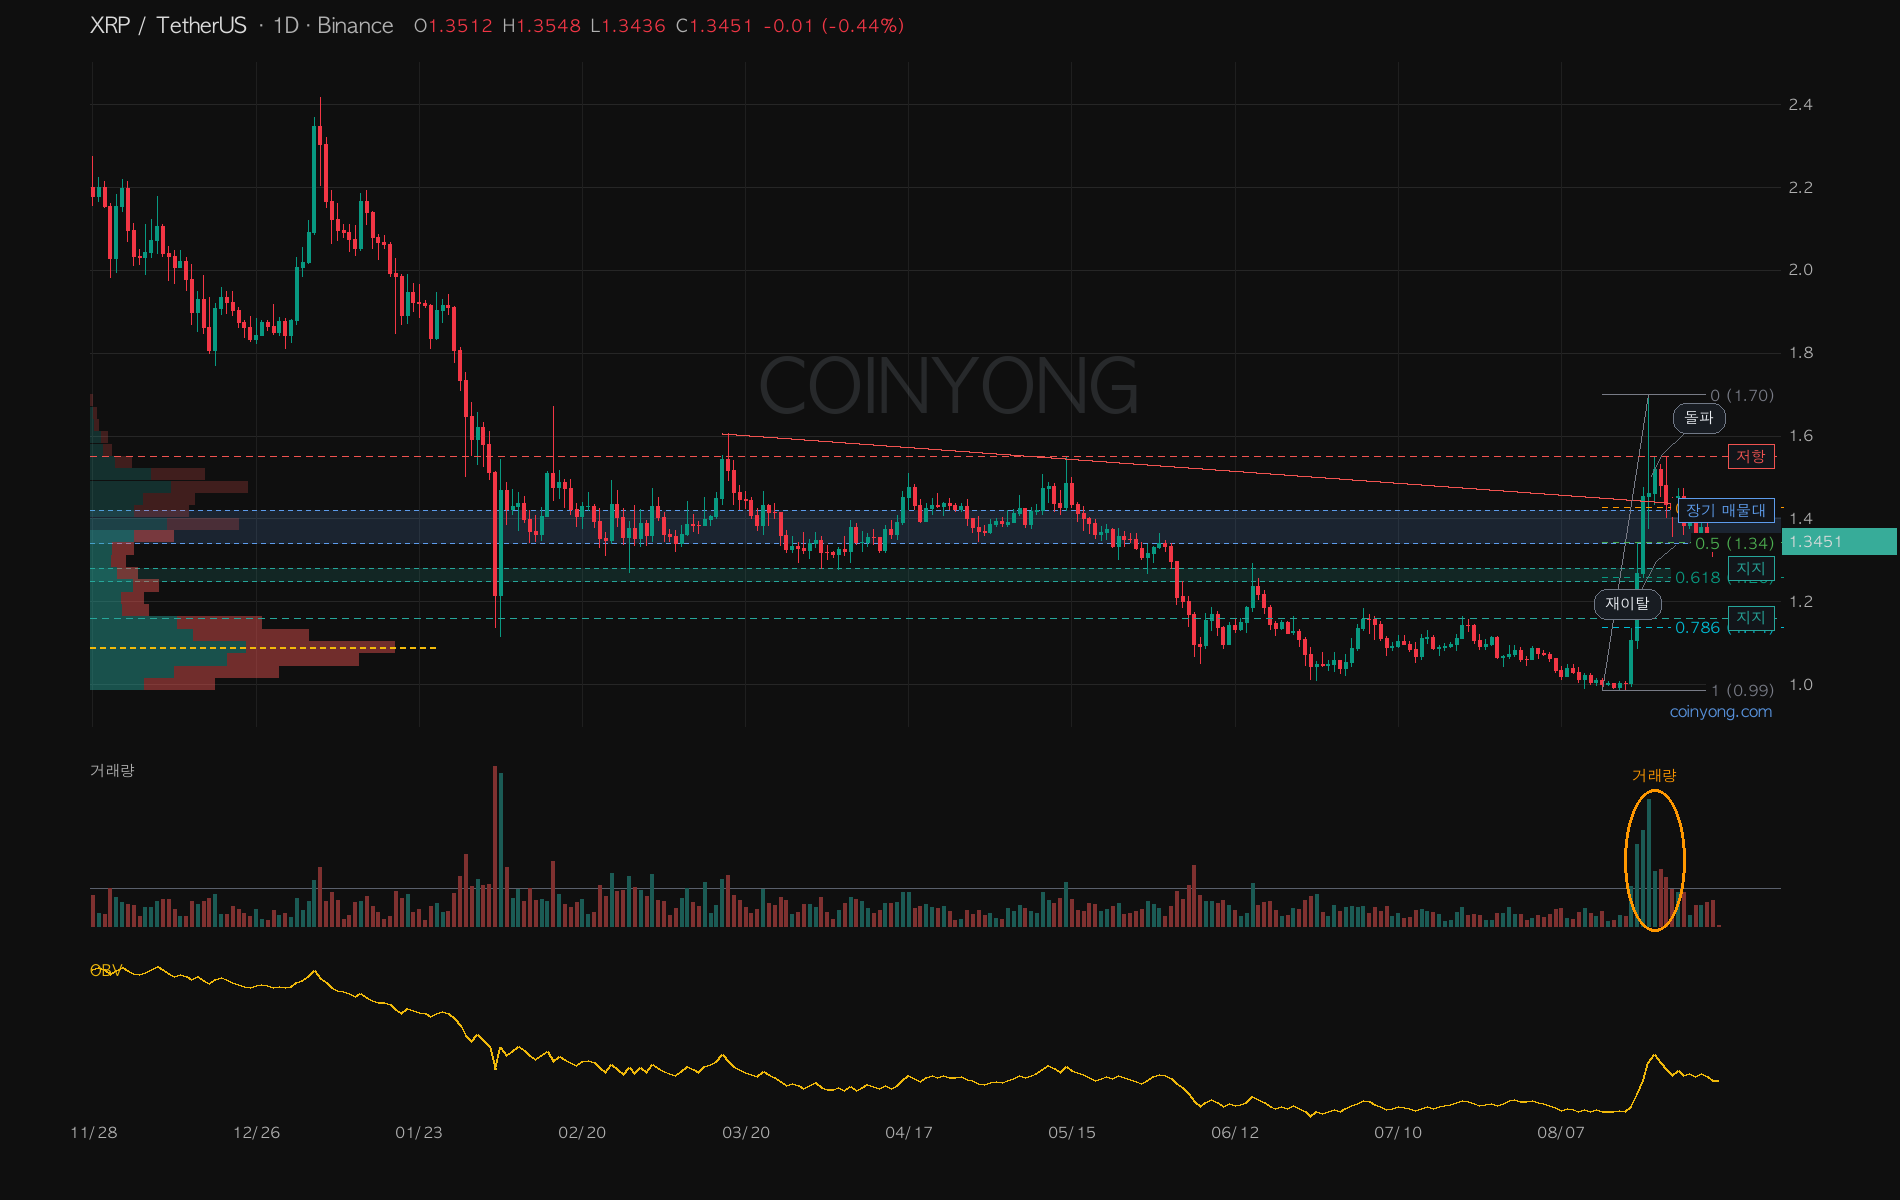
Still, there's a reason it isn't collapsing right away around $1.34.
Looking at the 240-day volume profile broadly, the zone with the most traded volume was $1.34–1.42, and from March through May support and resistance flipped around here several times.
The 80-day point of control is still at $1.09, which shows a difference: longer-term holdings are concentrated around the current price, while the supply built up this summer sits much lower.
On the daily, price has retraced half of August's rally to $1.34, and it needs to reclaim, in order, the 80-day value area high at $1.37, the average cost basis from the yearly low at $1.38, and the downtrend line at $1.43.
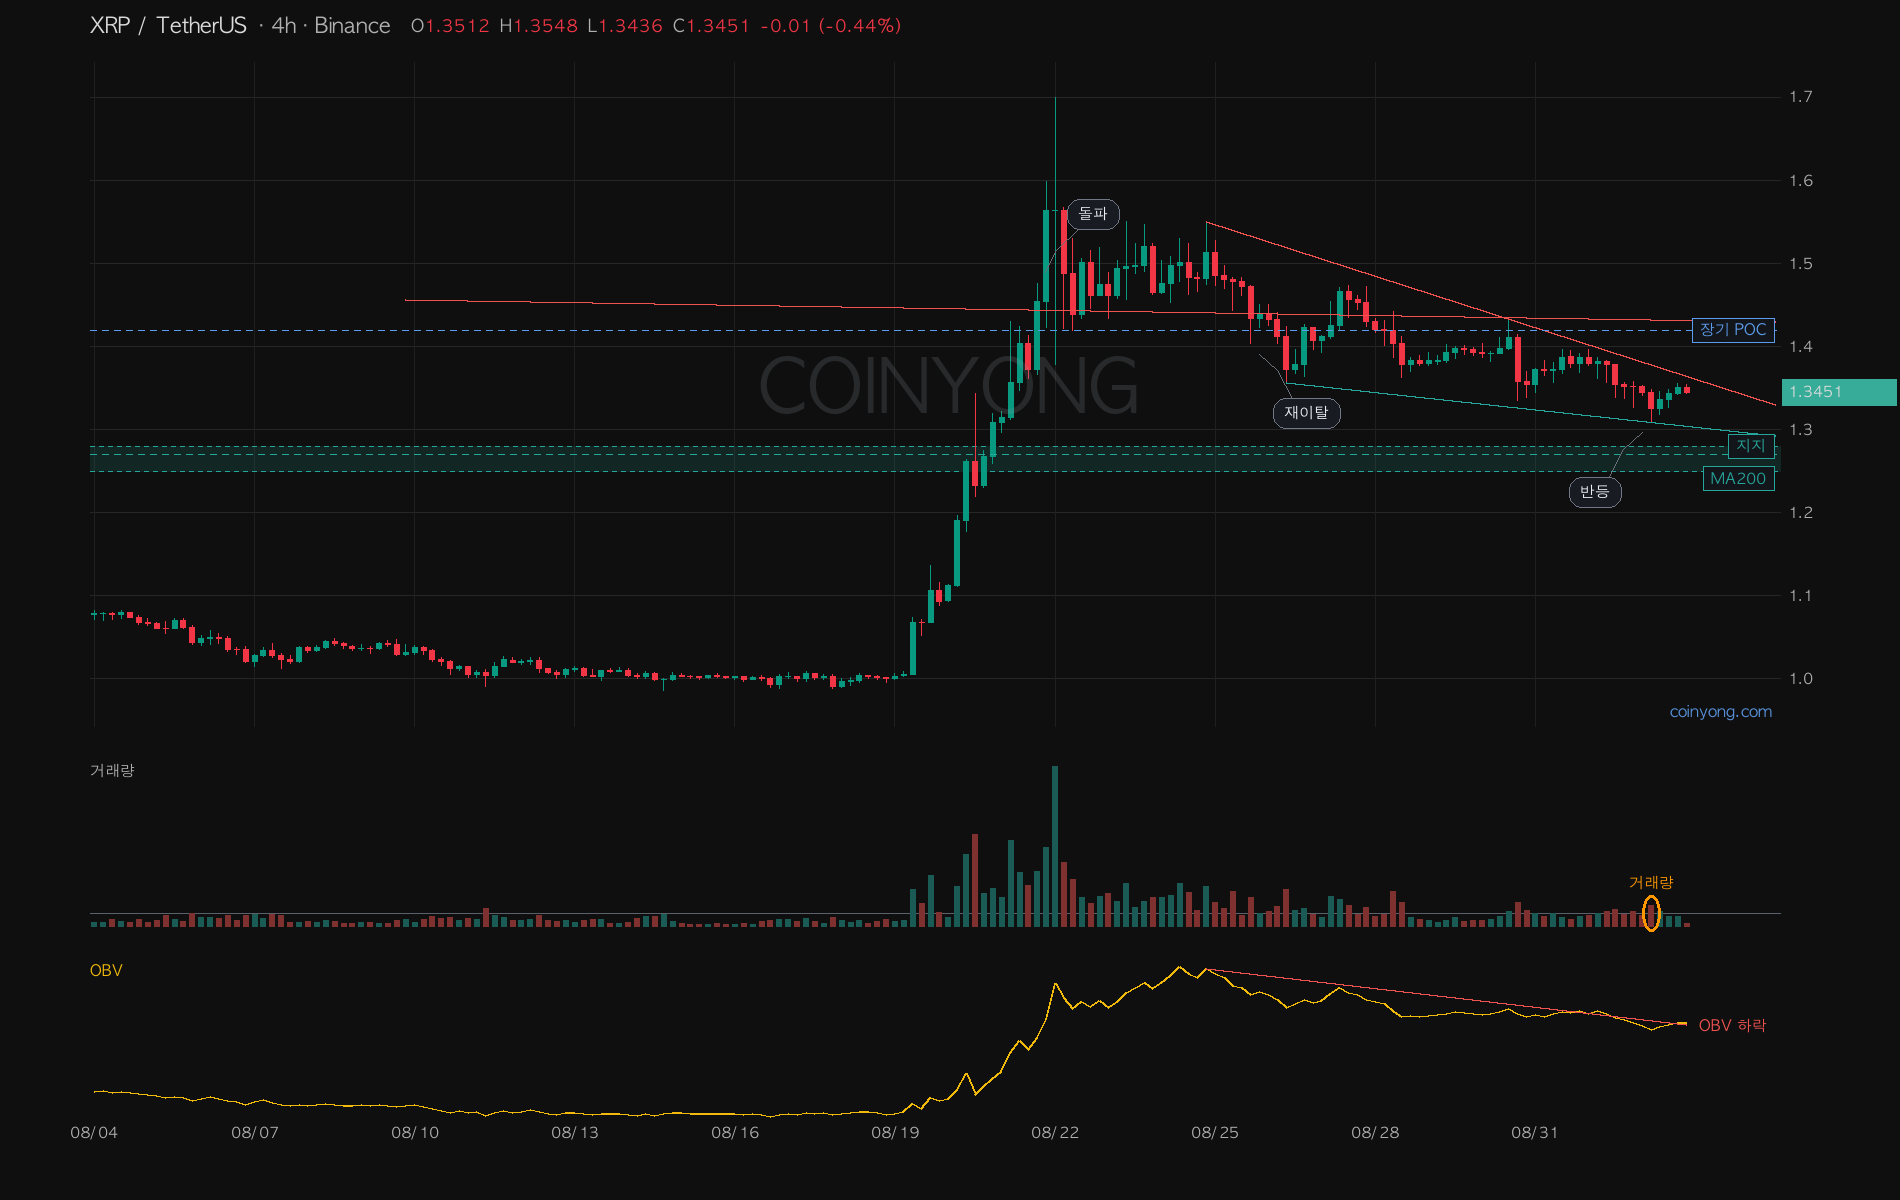
On the 4-hour, highs have been falling since $1.55 and lows have been pushed down to $1.31, putting price inside a falling wedge. OBV is falling along with it, so the volume behind any bounce is still weak.
That said, on September 2 it bounced off $1.31 on rising volume, and below there's still $1.27–1.25, where the daily MA200 and past weekly lows cluster.
A daily close back above $1.43 would repair the failed breakout, while losing $1.25 could reopen the path to $1.16.
Today's No. 1 ranking by trading value on Upbit is just a sign that interest has returned — what matters more right now than that ranking is whether it can get back above $1.43.
 ETH
ETH BTC
BTC LINK
LINK