XRP Pushes Back Above Yesterday's Resistance
 Coinyong
 XRP
XRP
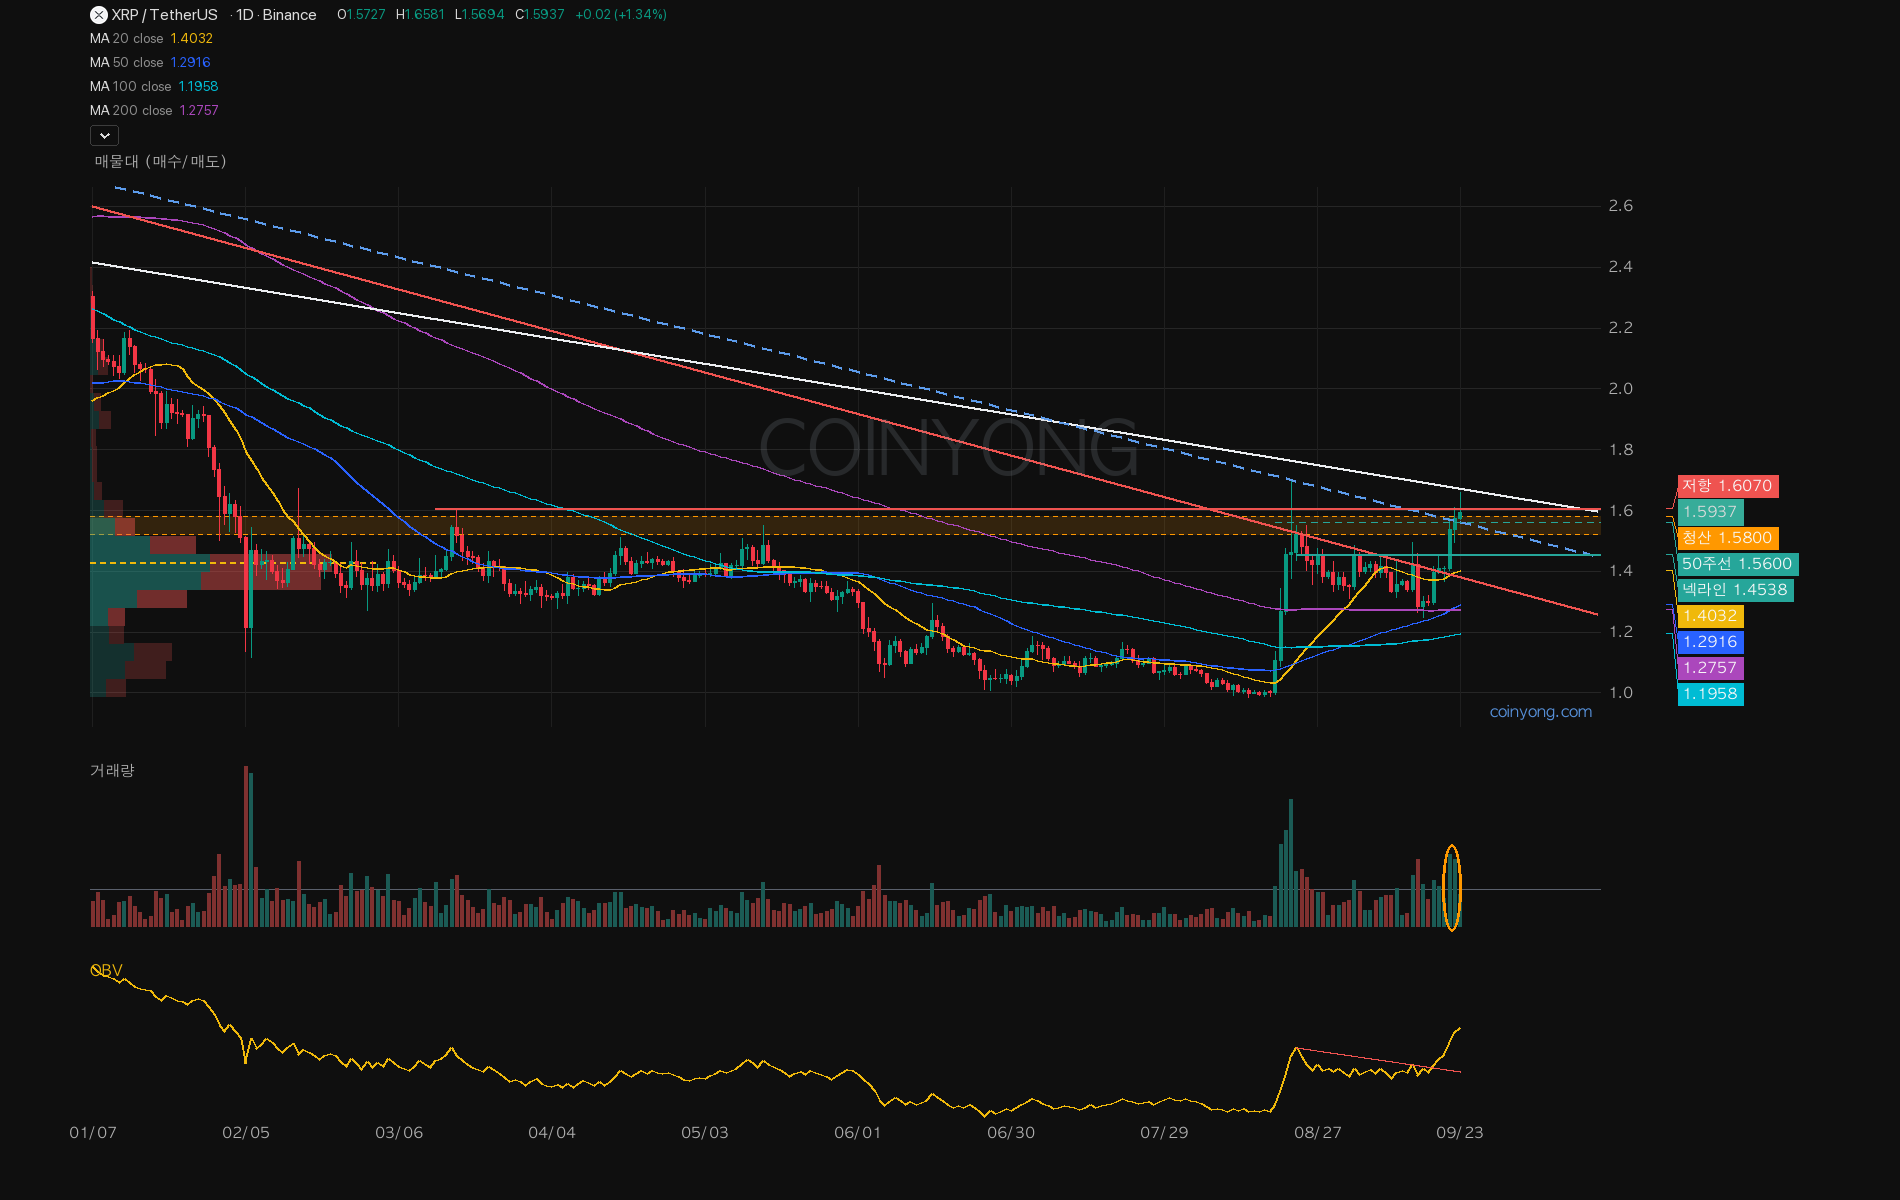
Yesterday XRP poked just above the March-high resistance at 1.607, left an upper wick, and got pushed back. Today it's trading on both sides of that level, making another attempt to break through.
In my last post I left more room to the downside, but it turned right around from last week's low and, two days later, closed above the invalidation line I had set.
The red line on the daily chart above is the trendline coming down from last summer's high, drawn on candle bodies. Price broke above it last week, and price also cleared the 50-week MA at 1.56.
The blue dotted line is an outer line connecting the wick tips, so treat it as reference only. The white line is a short downtrend line coming down from last November's high and currently sits around 1.66. Above 1.607 there's nothing in the way until that white line, and after that comes the August high at 1.70.
Volume was nearly double its usual level on both of the past two days, and futures open interest rose alongside it. Rising open interest means the move wasn't just shorts covering at a loss — fresh money came in too. OBV also broke the line that had been capping it since August and cleared its August high. That said, long liquidations are clustered in the 1.52–1.58 zone, centered on the 50-week MA at 1.56, so a slip into that area could set off cascading liquidations and a sharp drop.
If today closes above the 1.607 resistance, I see the path opening to the white line at 1.66 and then the August high at 1.70. If it slips back below 1.607, that liquidation zone around the 50-week MA at 1.56 could drag it lower. Next comes the 1.45 neckline around September's highs, and a close below that would make this breakout look like a failure.
Will it get above the level with a candle-body close this time, or end in another upper wick... Let's gooo!!!
 ETH
ETH BTC
BTC LINK
LINK