BNB Hit Hardest by the Binance Security Incident — Why the Bounce Looks Weak After Losing 705
 Coinyong
 BNB
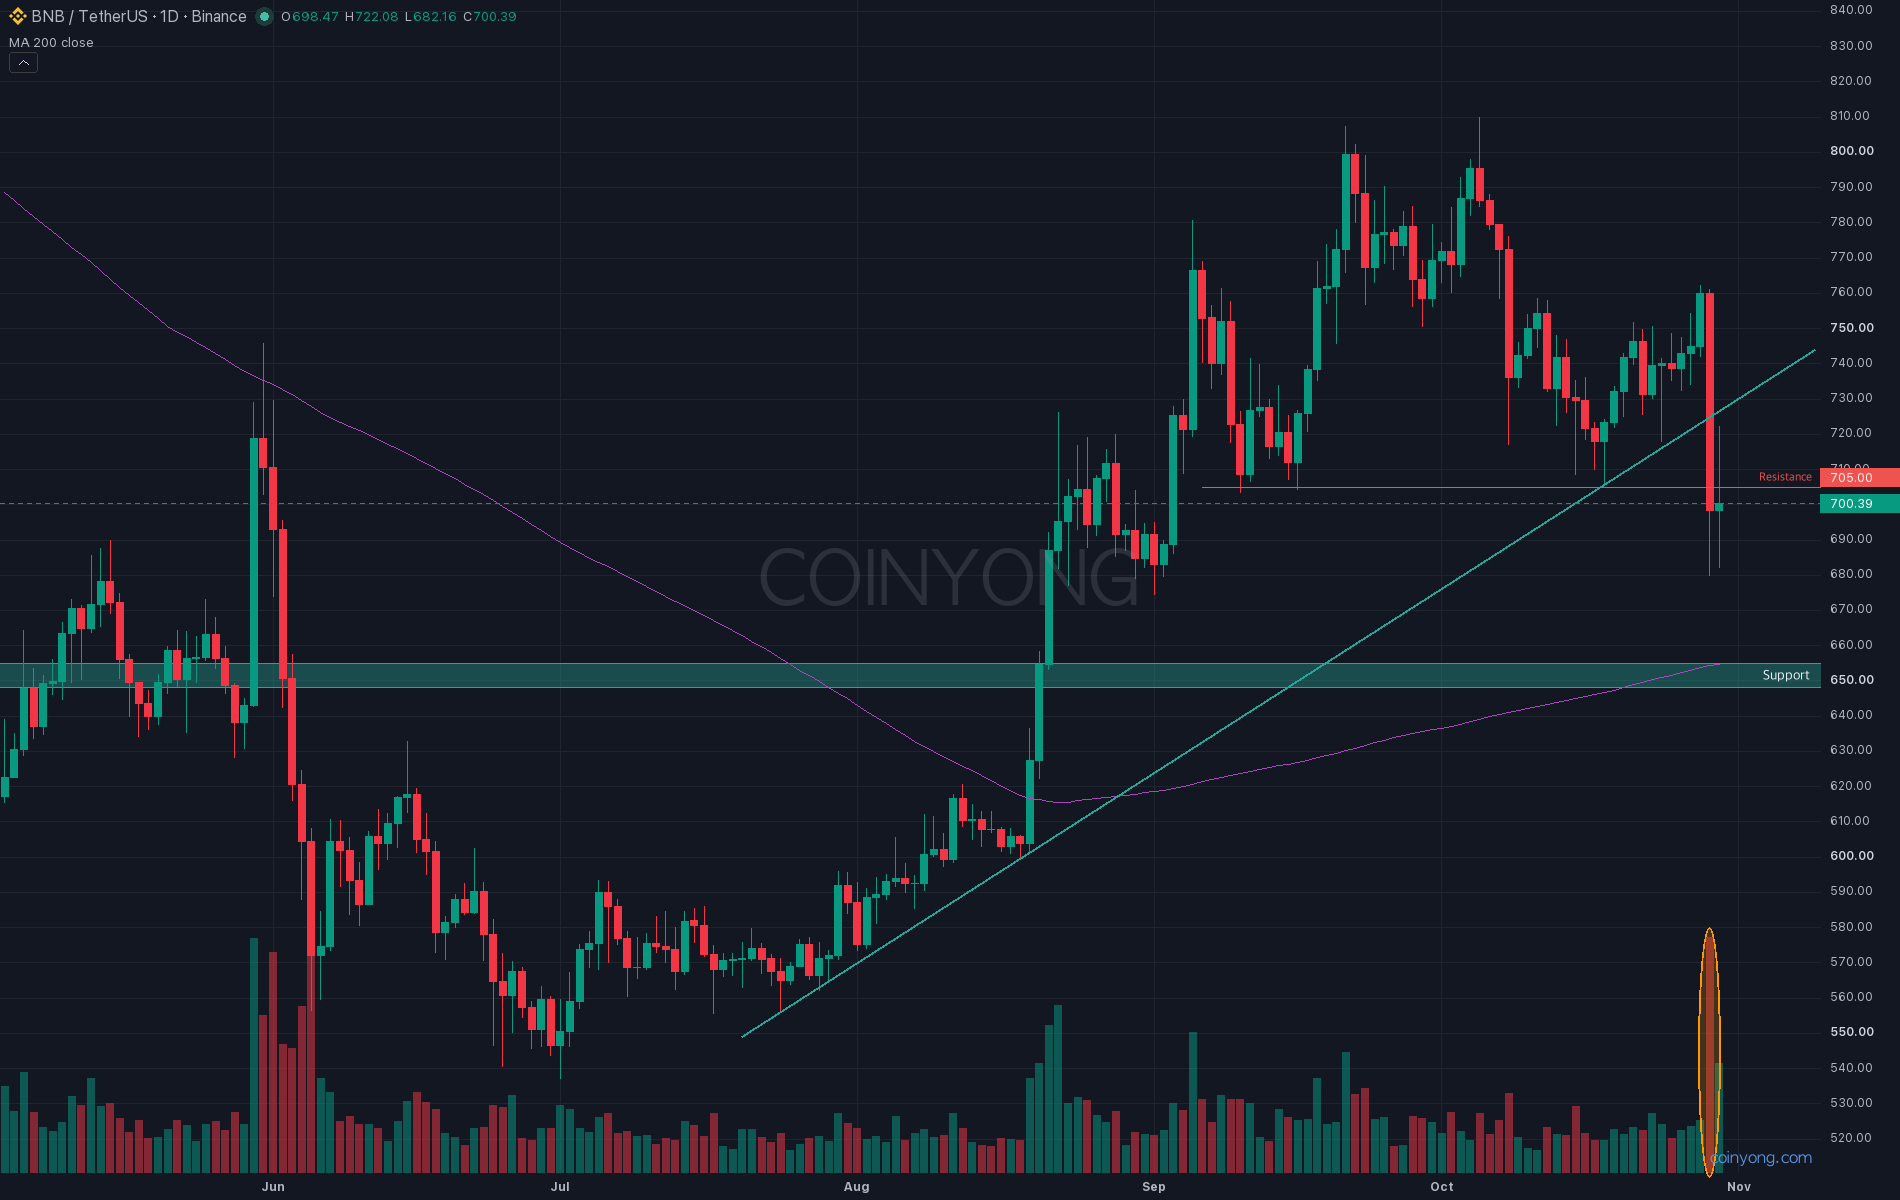
When Binance halted deposits and withdrawals over a security incident, BNB, Binance's native token, took the biggest hit. Yesterday's daily candle fell 8% from 760 to 698, nearly double Bitcoin's drop the same day (-4.1%). Can it hold 700?
This is the BNB daily chart. The floor at 703–706 that held three times — on September 10, September 16 and October 18 — broke on a single long bearish candle yesterday. Volume on that candle was 4.6 times the 20-day average, and the uptrend line that started at 556 in July and ran up to this floor broke along with it. Overhead, price has been rejected repeatedly at 752 and 762 since the October 5 high of 810 and hasn't been able to get past 810.
What matters here is the strength of the bounce. Breaking down the past day's trades by order size, only trades of $1 million or more showed net buying, of $16 million; every other bucket showed net selling, for a total of $63 million in net selling. Open interest, which jumped more than 9% during the crash, returned to its previous level within half a day, but the long-account ratio is still near 73%, indicating crowded long positioning.
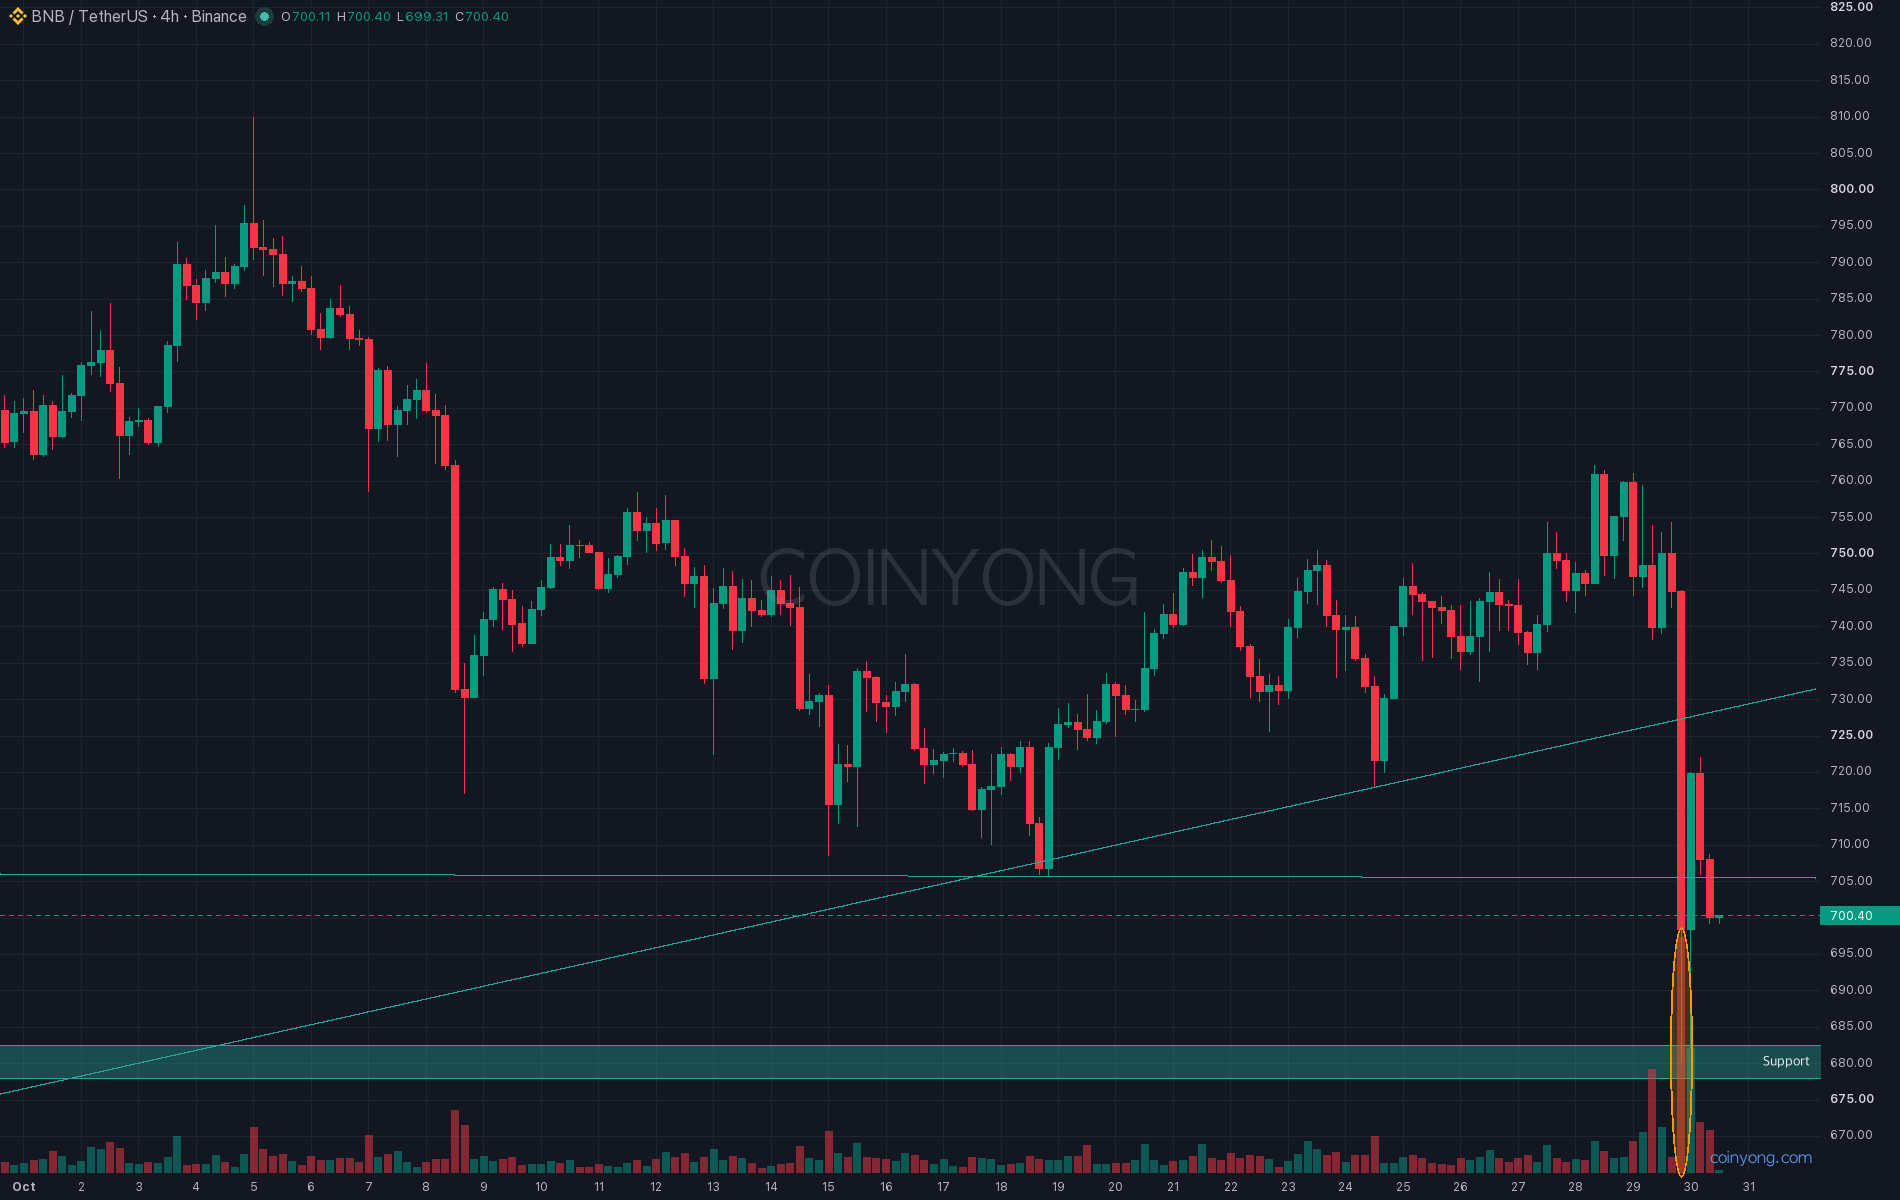
This is the BNB 4-hour chart. The 5 a.m. candle today printed a long lower wick from 745 down to 680 on 10 times the usual volume, and the following candles bounced back to 722 but stalled below the broken uptrend line (now around 727). The largest sell wall on the futures order book also sits at 720, and the 5 p.m. candle closed back below the 705 floor at 700.
The volume profile below is thin. Most of the past 30 days' trading built up above 700, and there was little trading in the 680–700 range, so a break below 700 could quickly open the way to today's low at 680. The largest bid wall sits at 680, which also lines up with the 50% retracement (683) of the rally from the mid-July low to this month's high.
In the end, I think continued 4-hour closes below 705 would lead to another test of 680, and a daily close below 680 would open the way to the 650 area, where the 200-day moving average (655) and the 61.8% Fibonacci retracement (653) converge. Personally, I'm leaning toward one more leg down rather than a bounce until deposits and withdrawals return to normal. On the other hand, a daily close above the broken uptrend line at 726 would invalidate this view, and the volume-heavy area around 750 would come back into focus.
Key resistance 705 - 727 (broken floor, uptrend line)
Near-term support 680 - 683
Next support 650 - 655 (200-day MA, Fibonacci 0.618)
Along with any news of Binance resuming deposits and withdrawals, the first thing to check is whether today's daily candle closes back above 705.
 ETH
 BTC