Ethereum Confirms a Break Below 2.3K Support — Is 2.1K Next?
 Coinyong
 ETH
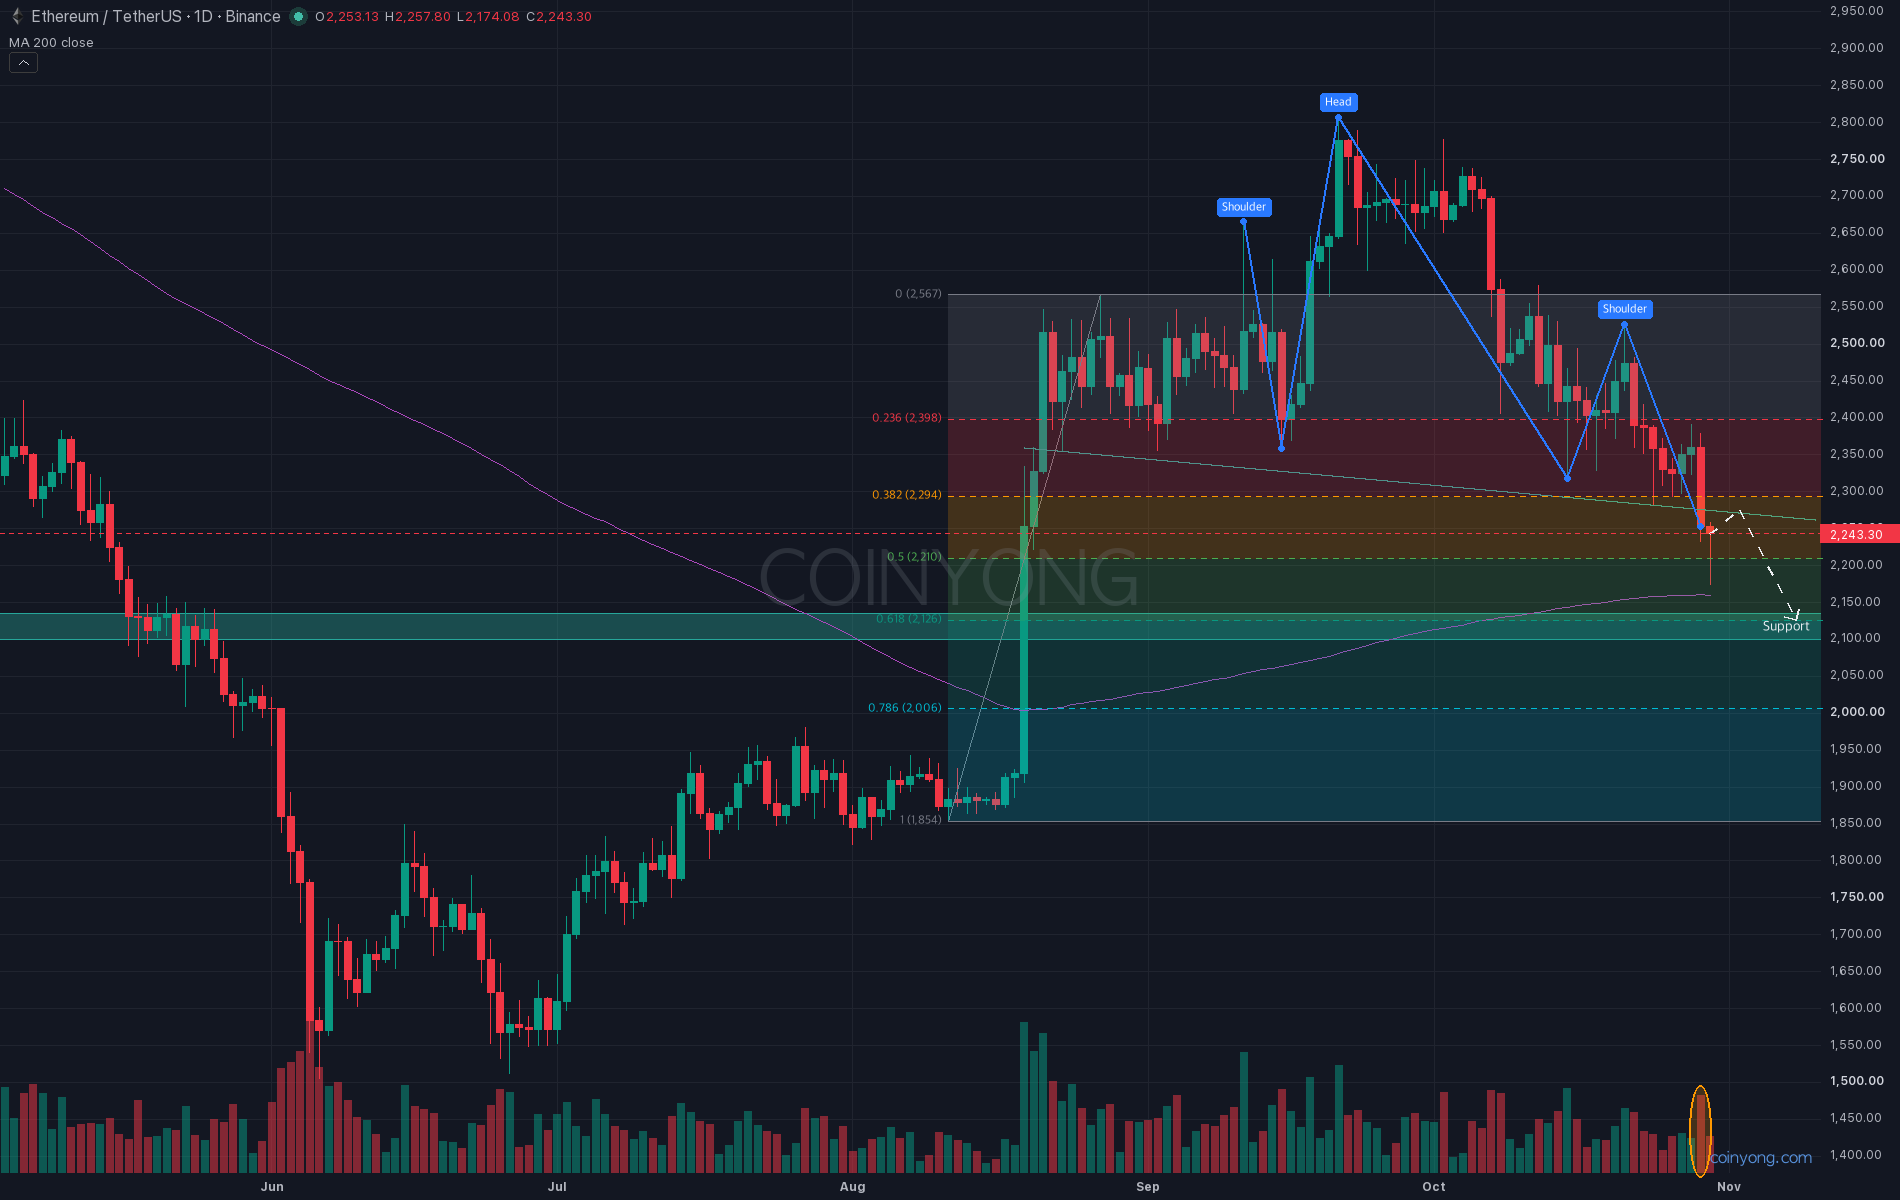
While the whole market slid after Binance's security incident, Ethereum (ETH) was weaker than Bitcoin. The 2.3K support it had held for more than a week finally broke on the daily chart. So where does it stop now?
This is the ETH daily chart. Three peaks — 2.67K and 2.81K in September, then 2.53K in October — formed a head-and-shoulders pattern, and yesterday's daily candle closed at 2.25K, below the neckline connecting the 2.32–2.36K lows beneath them. Volume on the breakdown candle was 1.7 times the 20-day average.
In my last post, I leaned toward a test of 2.13–2.17K if the 2.32K floor gave way. Yesterday's close broke that floor, and this morning's low reached 2.17K.
What matters here is what lies below. The 260-day volume profile shows thin trading at 2.16–2.27K and a heavy volume zone at 2.05–2.16K. Measuring the rally from the August low to the late-August high with Fibonacci puts the 0.618 level at 2.13K, and the weekly lows from August 2024 and June 2025 also sit at the same level, 2.11K. The daily 200-day moving average is just above at 2.16K.
Order flow also favors the bears. Breaking down the past day's trades by order size, every bucket was net selling, totaling more than $970 million. Over the same period, open interest fell 2%, suggesting long positions are being unwound, and the remaining long liquidations are clustered in two areas: 2.17–2.19K and 2.11–2.13K. The largest bid wall on the futures order book sits at 2.15K.
The broader market isn't in ETH's favor either. Bitcoin dominance is almost unchanged at 60.5%, while Tether dominance rose from the 6.7% area to the 6.9% area, suggesting money is moving into cash rather than rotating into alts. Over the past week, ETH has fallen nearly 3 percentage points more than BTC.
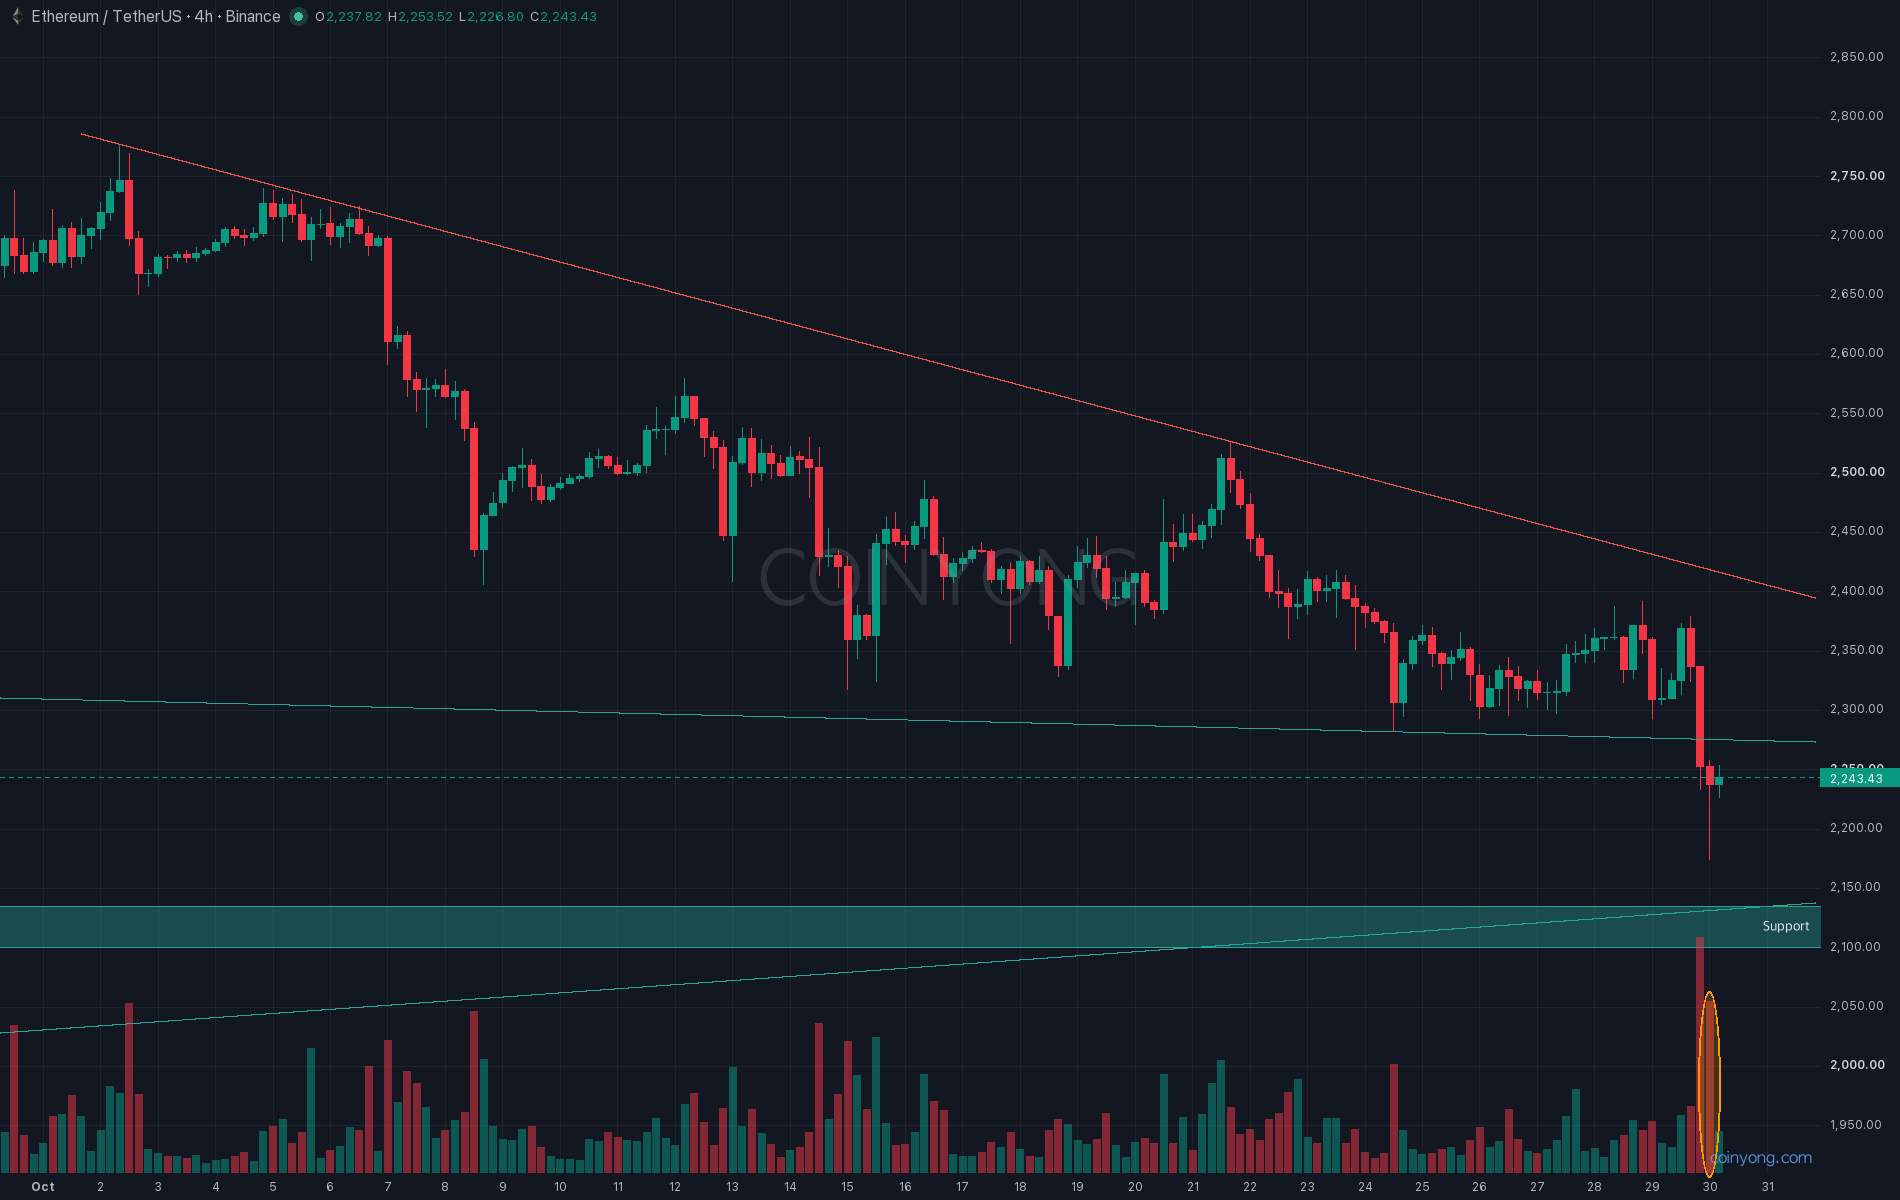
This is the ETH 4-hour chart. The support line that had connected the 2.28–2.36K lows since late August broke early this morning on a high-volume candle, and that line now runs through 2.27K as resistance. The next candle this morning came on 3.6 times normal volume and left a wick down to 2.17K, but the bounce stalled at 2.25K. Below, the rising support line that hasn't broken once since the August low is passing through 2.13K.
In the end, with the neckline lost, I see the current bounce as a retracement, and I'm leaning toward a test of 2.10–2.13K if 4-hour candles keep closing below 2.21K. With the daily RSI near 30, a rebound toward 2.27–2.30K wouldn't be surprising, but a daily close above the broken neckline at 2.32K would invalidate this bearish view and put the 2.4K downtrend line back in play.
Key resistance 2.27K - 2.32K (broken neckline)
First support 2.15K - 2.17K (200-day MA, bid wall)
Next support 2.10K - 2.13K (weekly lows, Fibonacci 0.618)
With options expiring this afternoon and the monthly close coming Sunday morning, now is the time to watch whether closes below 2.21K continue, rather than how big the bounce gets.
 BTC
 DOGE