Pepe Is Rallying — Will Dogecoin Get Rejected at Its 0.081 Downtrend Line Again?
 Coinyong
 DOGE
Memecoins are buzzing again. Pepe (PEPE) jumped almost 12% in a day and is up more than 20% over the past month, yet Dogecoin (DOGE) is down 15% over the same stretch and is stalling around $0.08 (about ₩106 on Upbit). Memes are running — so why isn't DOGE keeping up?
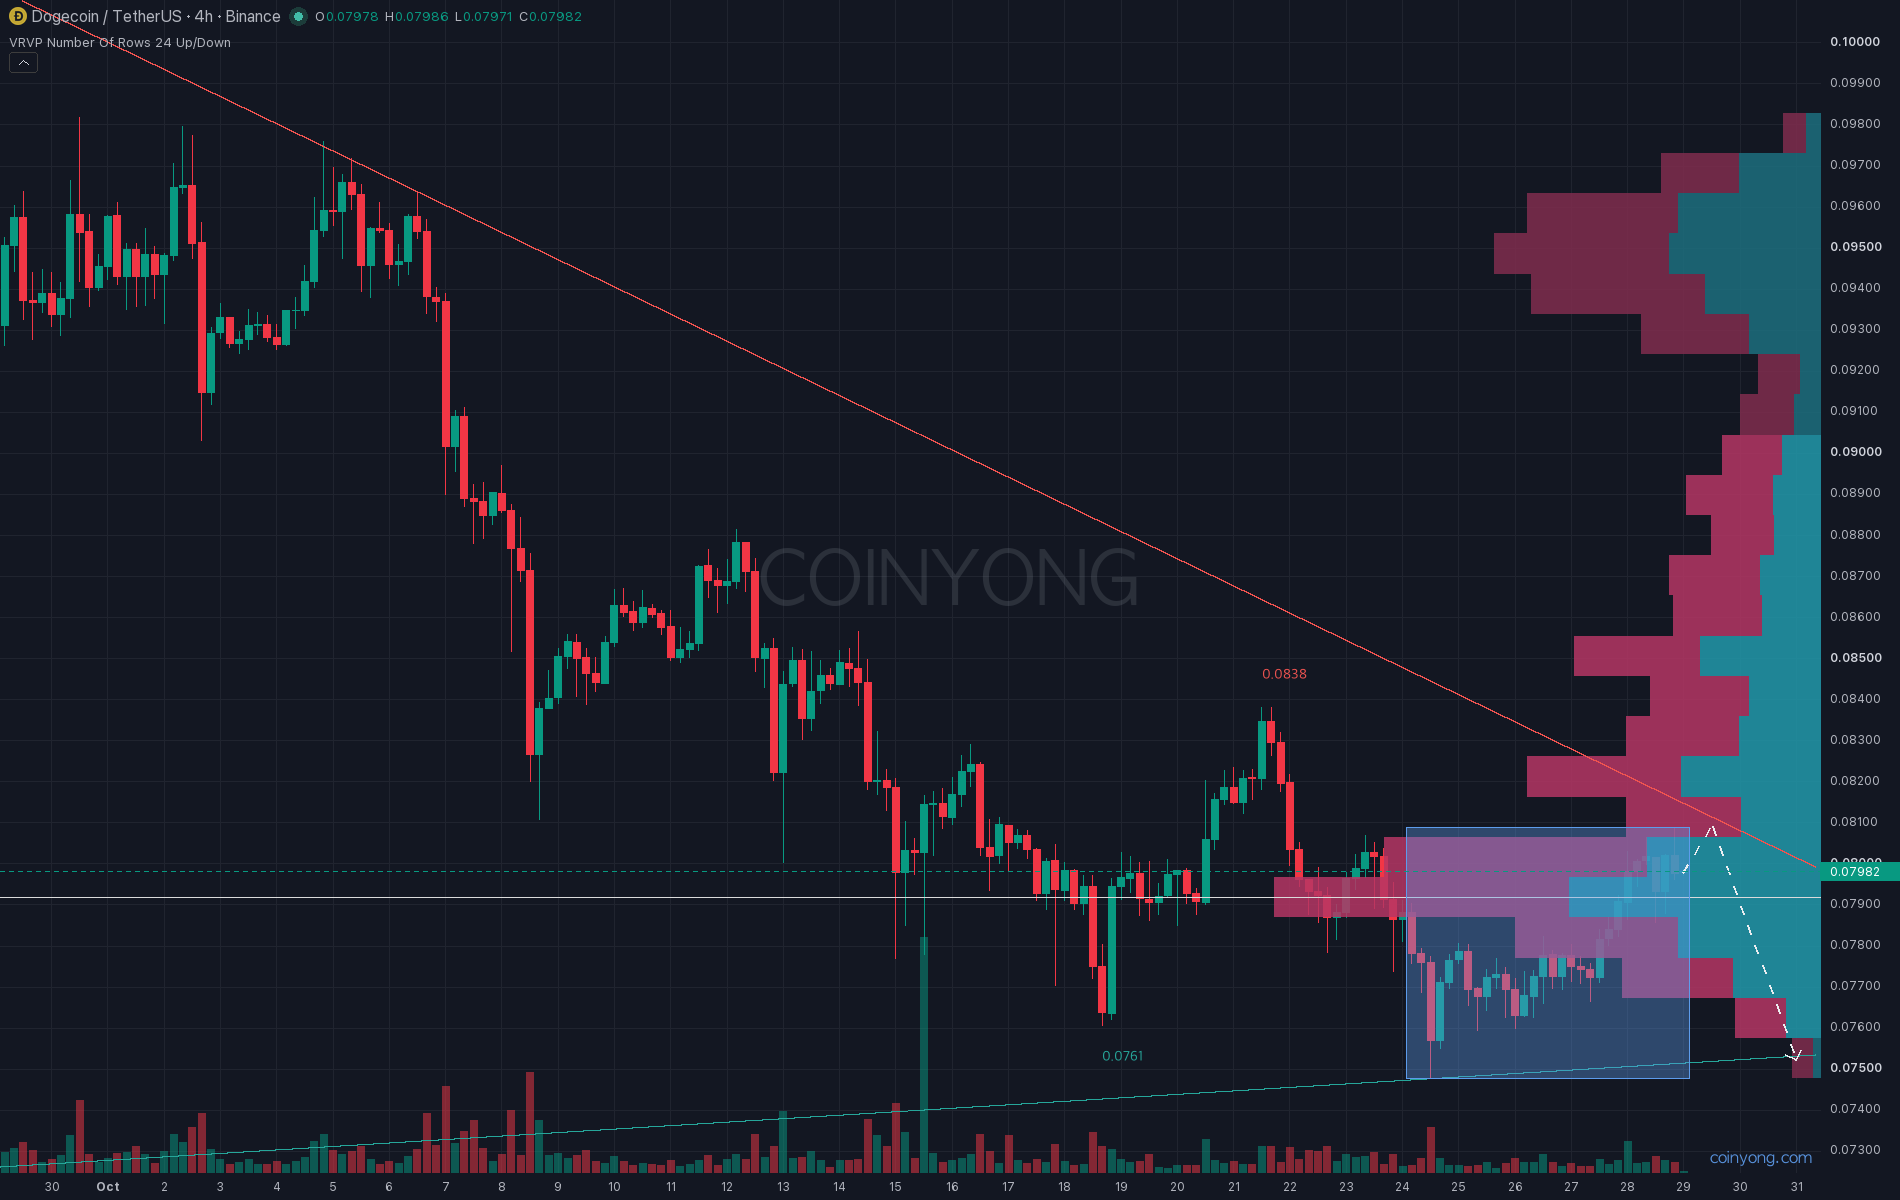
This is the DOGE 4-hour chart. The downtrend line connecting the September 22 high at 0.1059 and the October 4–6 highs is passing near 0.0815 today. Since the 24th's low at 0.0748, price has been stuck in a 0.0748–0.0809 range, and since the 28th it has tested the top of that range several times without breaking through.
The US Federal Reserve held rates at 3.75–4% at 3 a.m. on the 29th, Korea time. Two of the 12 voting members actually wanted a hike. After the announcement, DOGE rose to the top of the range at 0.0809 overnight, but that 4-hour candle left an upper wick and closed at 0.0798.
What matters here is that several resistance levels stack up at 0.080–0.0815. The daily 20 MA and the weekly 20 MA sit at 0.081, the 4-hour 100 MA at 0.0802, and the largest sell order on the Binance futures order book is currently parked at 0.0812.
The bounce also looks weak. Daily volume is below its 20-day average, and the 4-hour MFI is already overbought at 82. In futures, longs make up 77% of positions among Binance's top traders, and long liquidations are estimated to be clustered between 0.076 and 0.0776, so a drop could pick up speed once it starts.
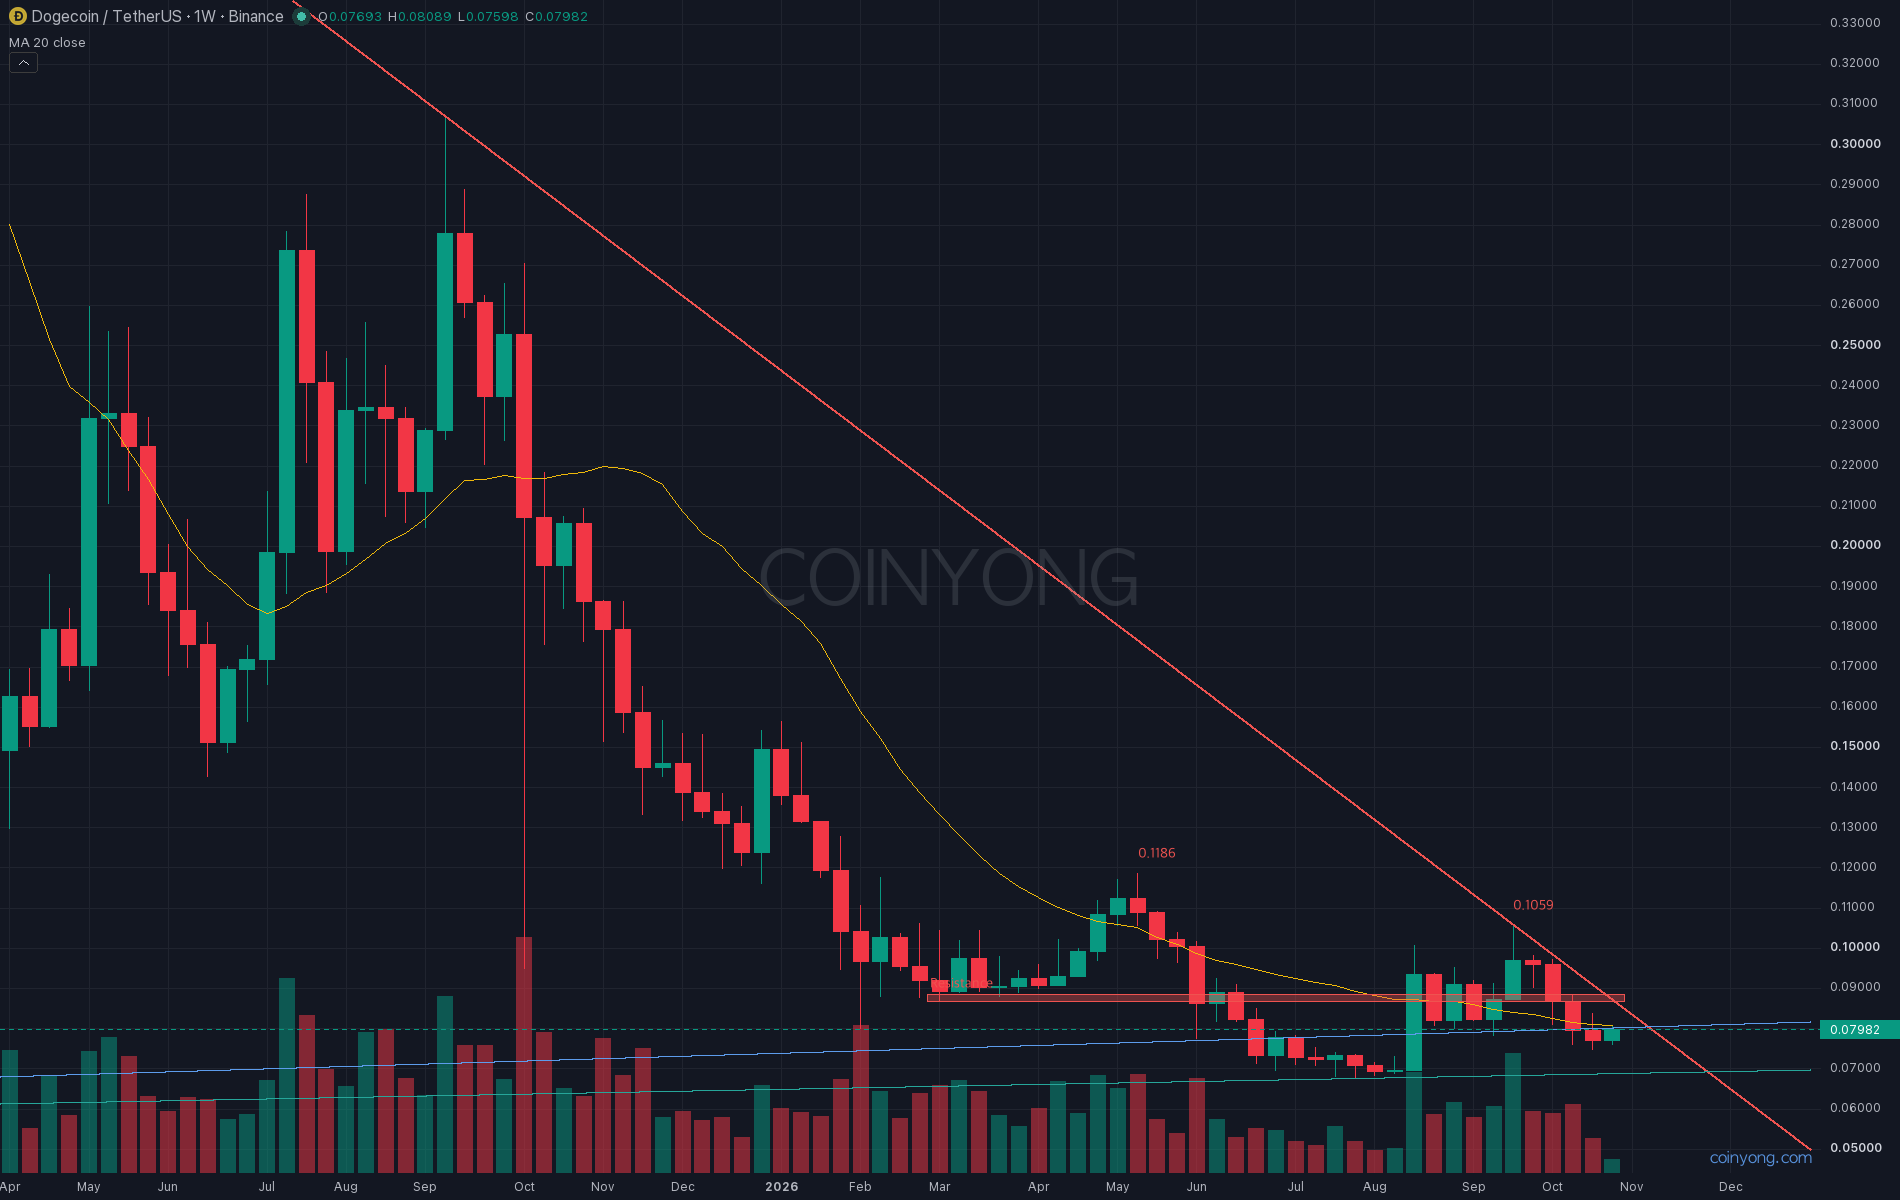
This is the DOGE weekly chart. The weekly high stepped down from 0.1186 in May to 0.1059 in September. 0.088, the March low area, was reclaimed on weekly closes for two weeks in late September, then lost again in the first week of October. In the second week, price bounced back to 0.0881 but closed lower at 0.0794.
The support line that had held the floor since 2023 also gave way in June, and that line now runs near 0.080 as resistance. A two-year downtrend line connecting last January's high and this September's high also meets the 0.088 resistance around 0.087.
In the end, I'm personally leaning toward another rejection near 0.081, followed by a move through the 18th's low at 0.076 to 0.075, where the 4-hour rising support line sits, and then a test of the range bottom at 0.0748. If that gives way too, the next level is the five-year support line (0.069) just above the July low at 0.0677. On the other hand, a daily close above the 21st's high at 0.0838 would invalidate the bearish view and put the 0.088 resistance back in play.
Key resistance 0.080 - 0.0815 (4-hour downtrend line, top of the range, 20-day MA)
Near-term support 0.0748 - 0.0752 (24th's low, rising support line)
Next support 0.0677 - 0.069 (July low, five-year support line)
After tonight's PCE inflation release, the first thing to watch is whether a 4-hour candle can get above 0.0815.
 SOL
 XRP
 MARKET