XRP at the Tip of a Descending Triangle — If 1.25 Breaks, 1.14?
 Coinyong
 XRP
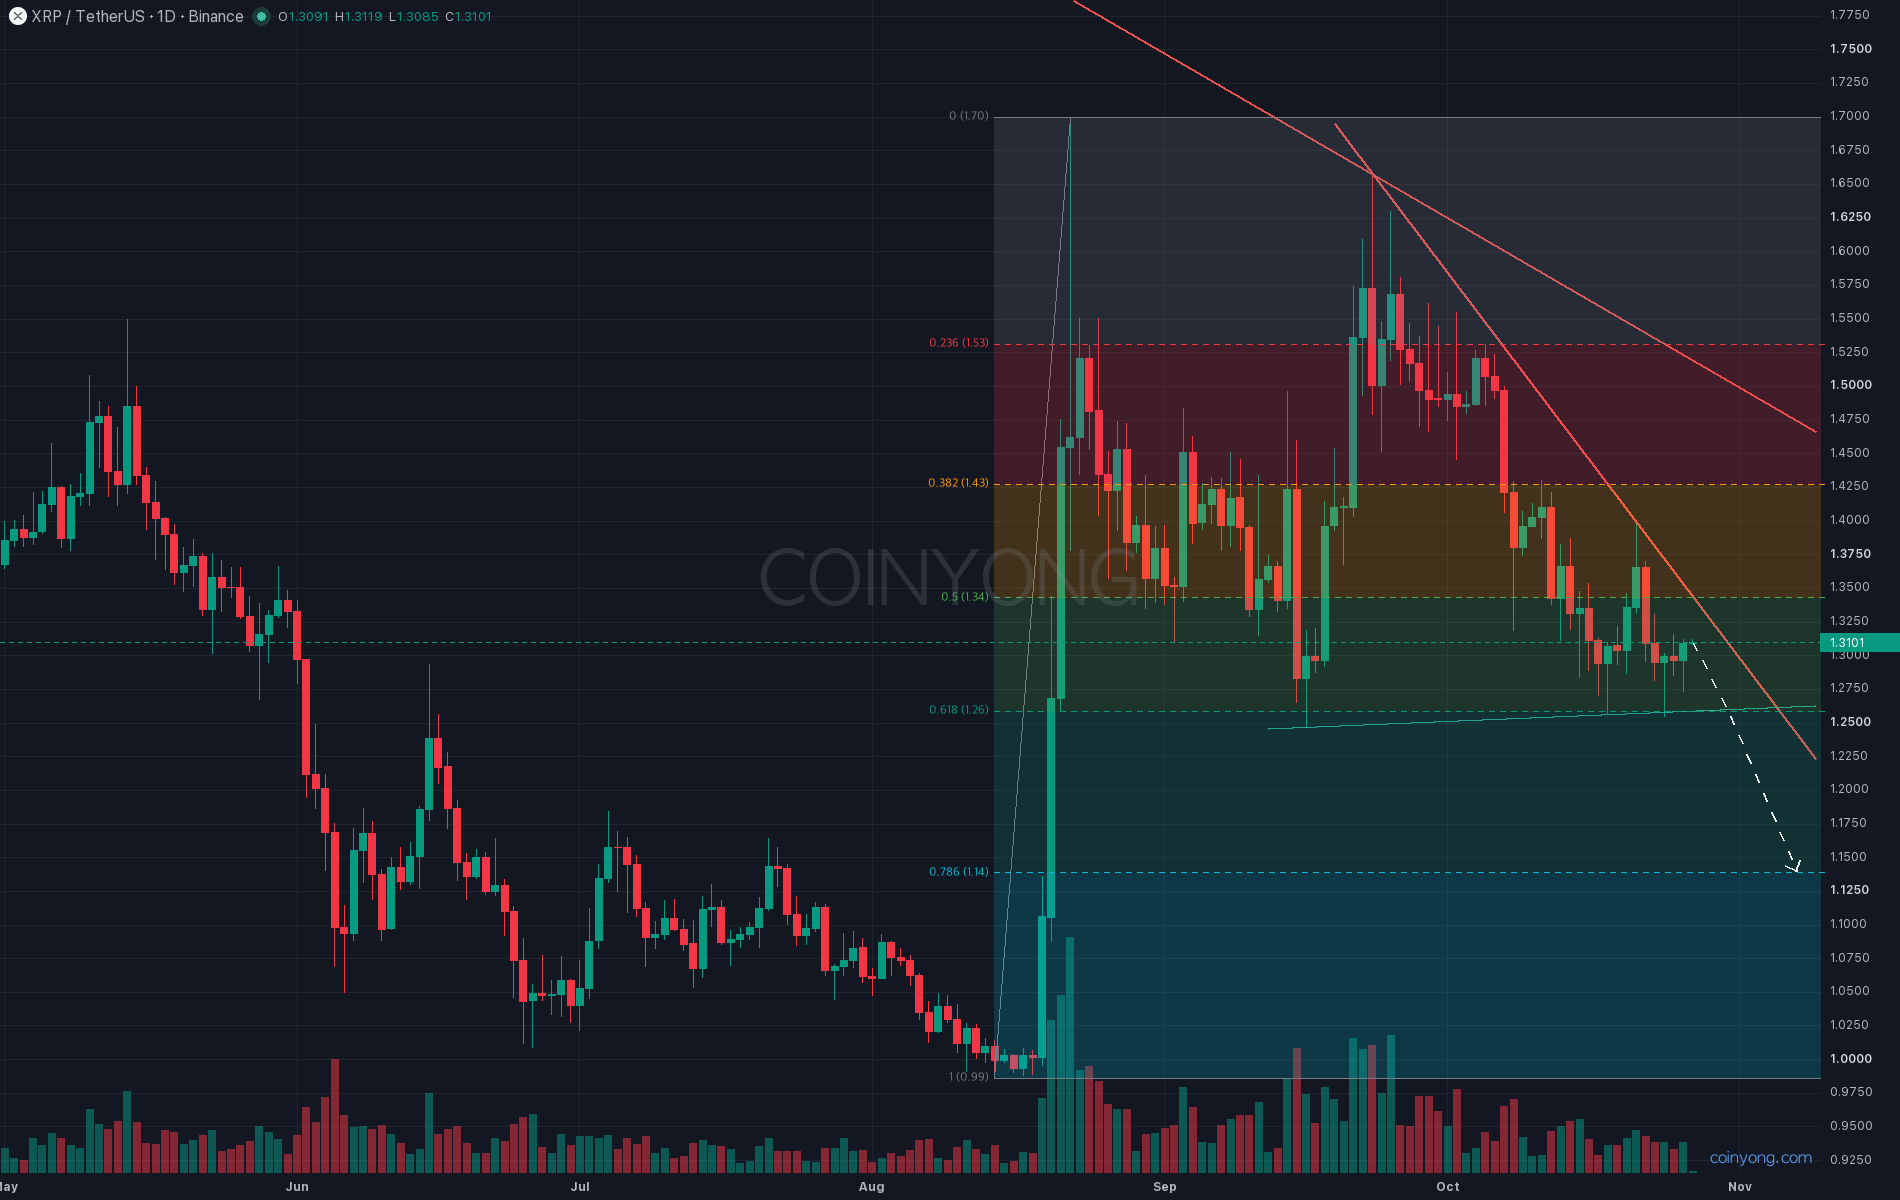
XRP has now confirmed a third bounce near 1.25. The September 16, October 18, and October 24 lows all stopped around 1.25. In the meantime, highs have kept stepping down from 1.66 to 1.40.
This is the XRP daily chart. The downtrend line from the September high and the 1.25 floor have formed a descending triangle, with about nine days left until the apex. The October 21 bounce was rejected right at that downtrend line. 1.25 lines up with the 61.8% retracement of the August rally, and the daily 200 MA runs just above at 1.28, so it won't give way easily, but the sellers have been winning more often than the buyers.
My last post leaned toward a drop to 1.40 if 1.45 gave way. The October 7 daily candle closed at 1.42, losing that level, and price fell to 1.32 the next day.
Bitcoin briefly slipped below $80K overnight before recovering, and the US rate decision comes out at 3 a.m. on the 29th, Korea time. Sentiment around altcoins is weak. USDT dominance has risen from 6.4% a month ago to 6.85%, and altcoin market cap excluding BTC and ETH has shrunk by more than 9% over the same period.
What matters here is order flow. Over the past week, sellers had a slight edge in executed trades, and volume didn't pick up even as price tested the floor. Yet long accounts outnumber short accounts roughly three to one in the futures market. Long liquidation orders appear to be clustered just below the 1.24–1.28 zone, so if 1.25 gives way once, the decline could accelerate.
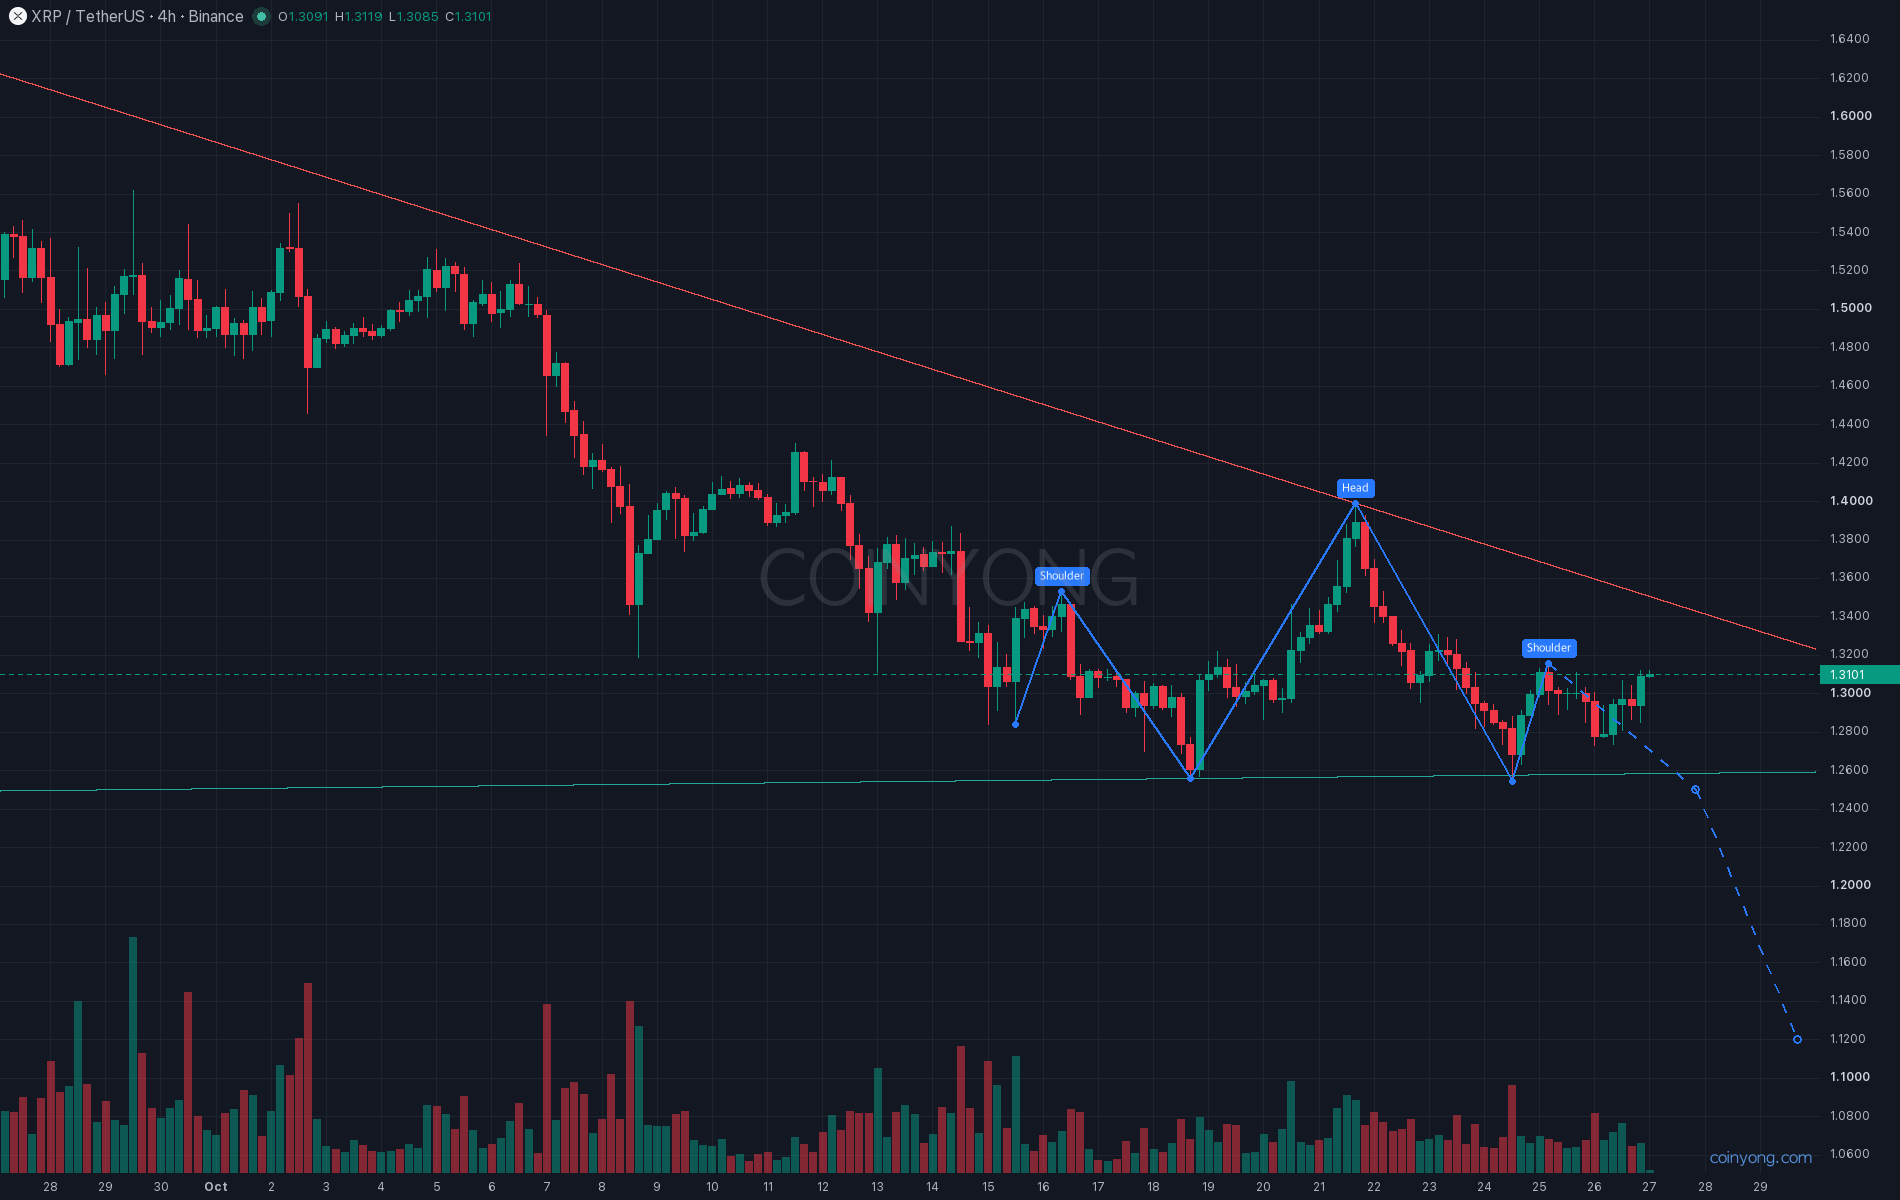
This is the XRP 4-hour chart. Inside the triangle, the October 16, 21, and 25 highs formed a small head and shoulders, with the neckline at the same 1.25. If the neckline breaks, the measured move from the pattern points to around 1.11, and the 78.6% retracement of the August rally at 1.14 and the February low at 1.12 are nearby too, so 1.12–1.14 looks like the next zone.
In the end, I'm leaning toward 1.25 giving way this week and a slide to 1.12–1.14. On the other hand, a daily close above 1.34 would mean a break above the downtrend line, invalidating the bearish view and setting up a test of 1.40, where the daily 50 MA sits. Above that, the long-term downtrend line from last September's high runs near 1.52 and remains major resistance.
Key resistance 1.34 - 1.35 (downtrend line, 50% retracement, daily 20 MA)
Key support 1.25 - 1.28 (floor that held three times, daily 200 MA)
Next support 1.12 - 1.14
The key question this week is whether XRP can hold 1.25 on a daily closing basis after the rate decision.
 MARKET
 ETH
 BTC