Solana at the $100 Head-and-Shoulders Neckline — Why a Drop Looks More Likely
 Coinyong
 SOL
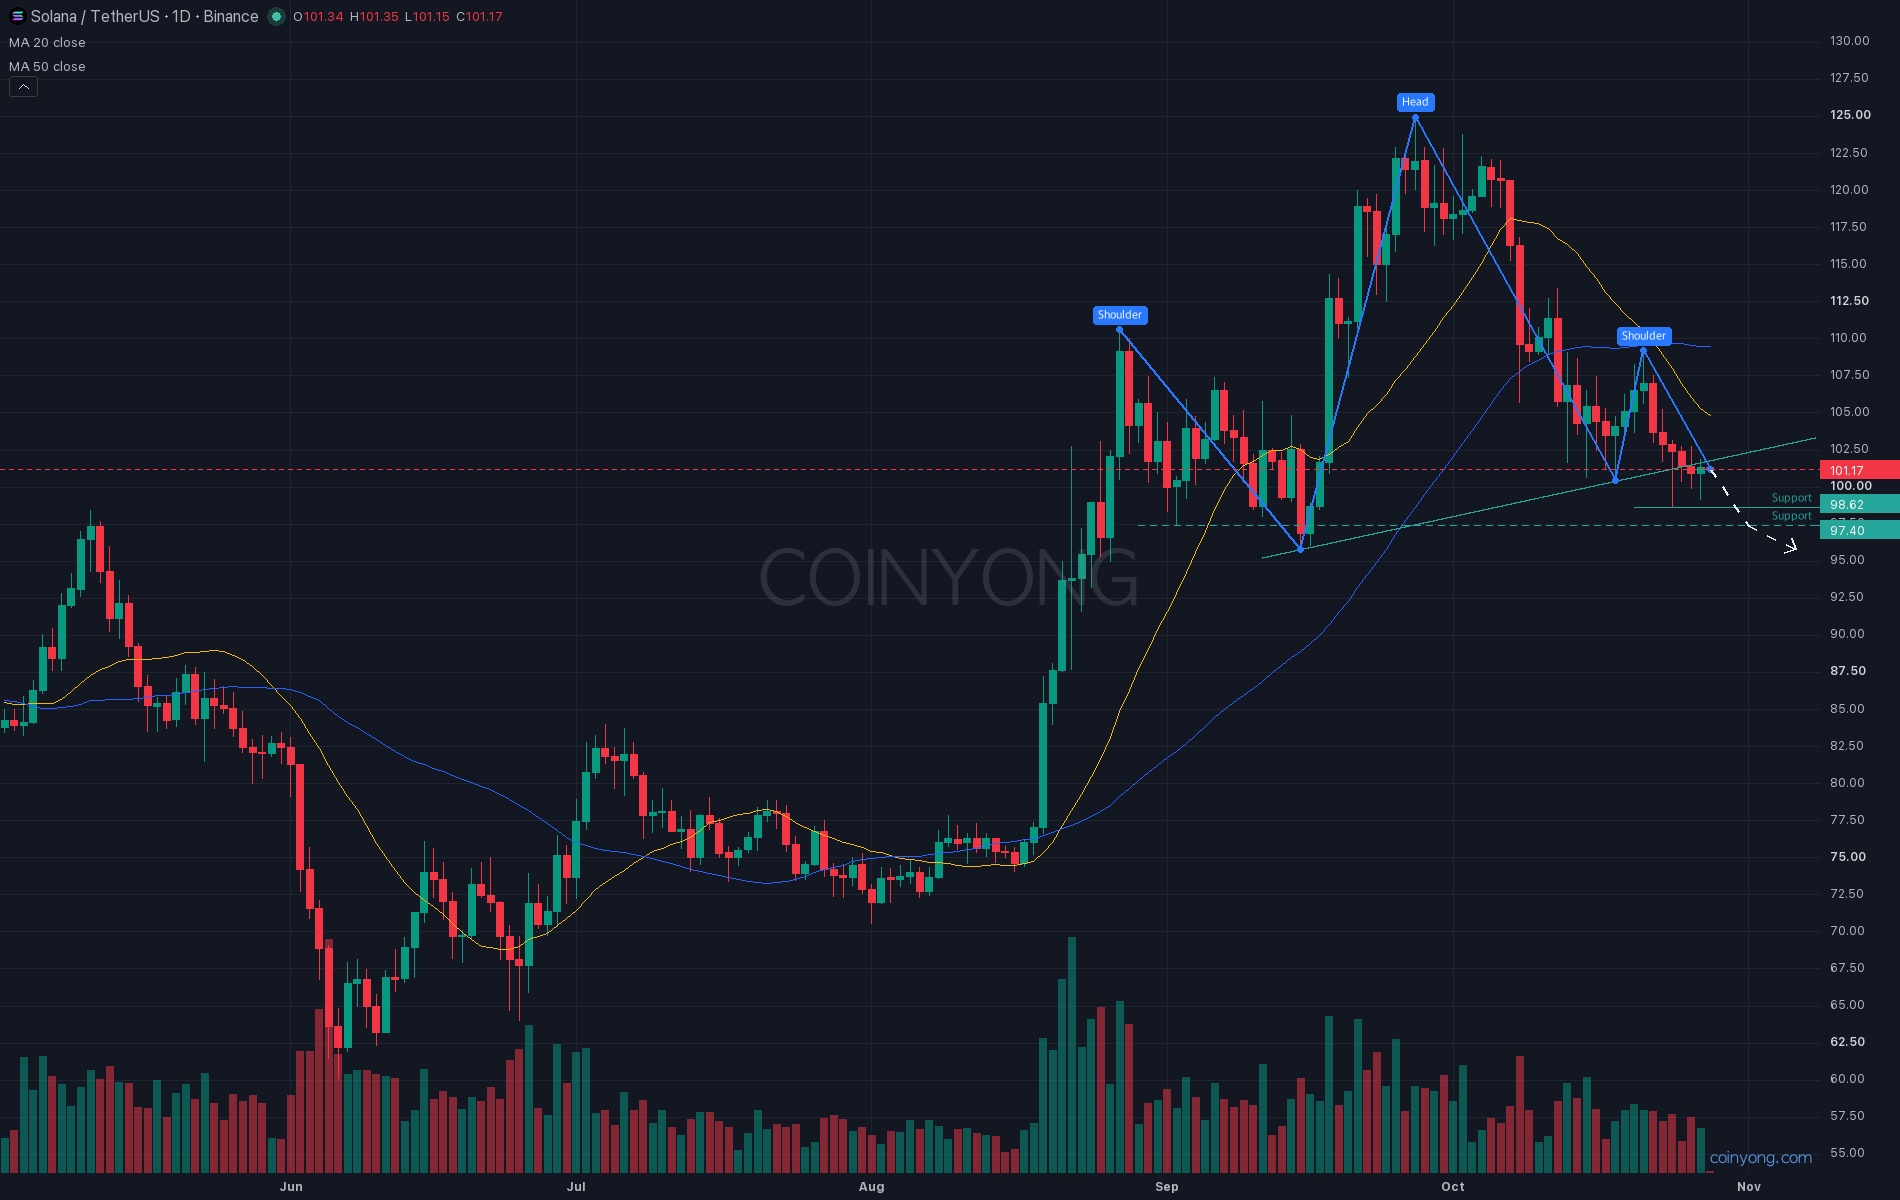
Solana (SOL) has been drifting sideways around $100 for five days. After climbing to 125 in late September, it has dropped almost 20% in a month. The big question now is whether 100 can hold.
This is the SOL daily chart. The three highs on August 27 (110.6), September 27 (125), and October 21 (109.2) formed a head-and-shoulders pattern. The two shoulder highs differ by only about 1.3%, so it's a fairly clean head and shoulders.
The neckline connects the September 15 low at 95.8 and the October 18 low at 100.4, and the daily candles on the 26th and 27th closed just below it. Price hasn't moved far below yet, so it's too early to call it confirmed. The key support is 98.6, where the October 24 candle's lower wick bottomed out.
My last post leaned toward a drop to 112.5–114.5 if the bottom of the 116–117 range gave way. Price actually fell to 105.7 on October 8, and highs have kept coming in lower since then.
The daily chart has slipped below the 20-day MA (around 105) and the 50-day MA (109.5), and on the directional indicator, -DI (26.5) is nearly double +DI (13.0). Volume is quiet at about 70% of the 20-day average, so buyers aren't stepping in aggressively to defend price.
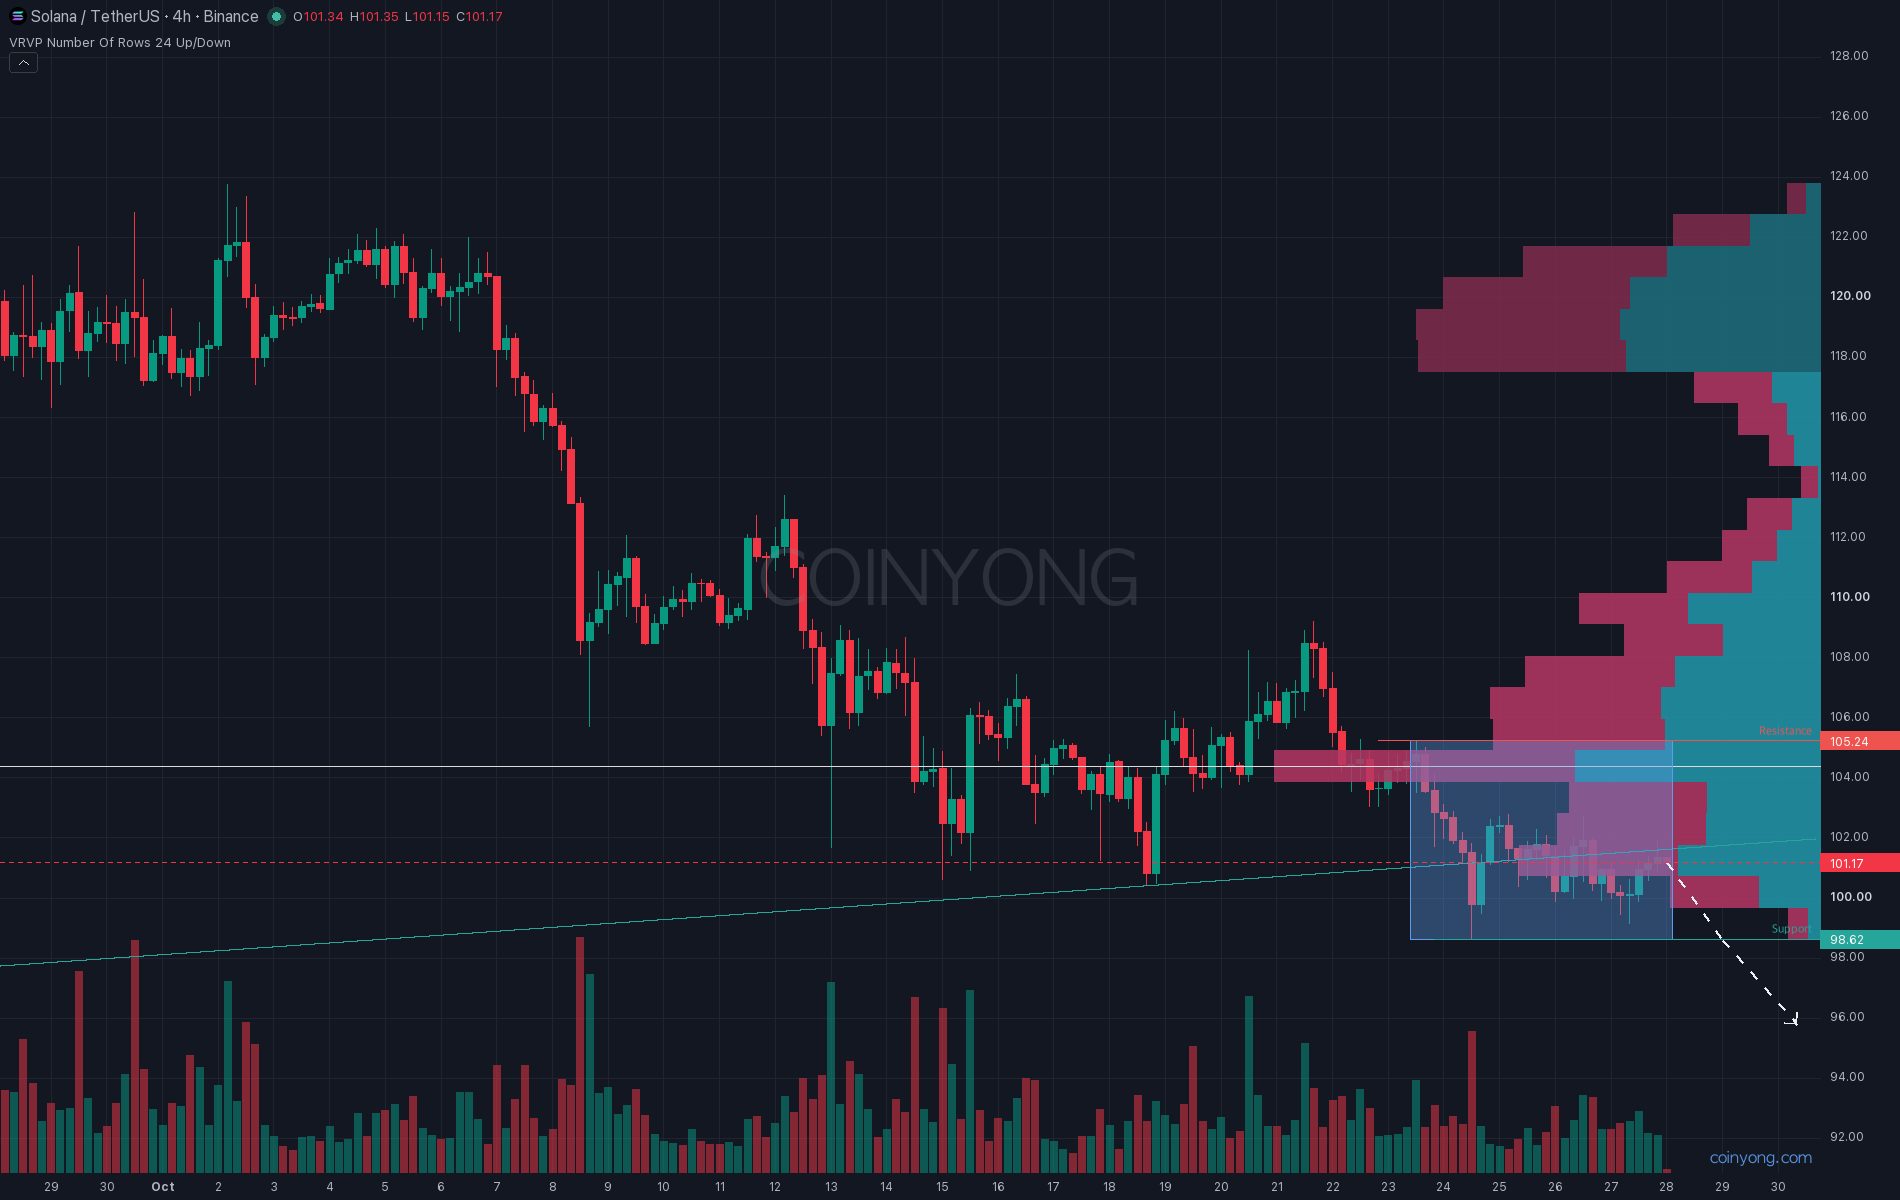
This is the SOL 4-hour chart. Price broke below the uptrend line that had supported successive lows since late August on the night of the 24th and is now trying to climb back from below it. Since the 24th, it has been stuck in a 98.6–105.2 range, and the bounces on the 25th and 26th both stalled in the middle of the range.
On the one-month volume profile, the heaviest traded zone is around 104.1, above the current price. By contrast, price hasn't traded below 98.6 at all this month, and even on the 260-day profile, volume in the 95–101 zone is only about half of the zone right above it. That's why the decline could accelerate if the bottom breaks.
What matters here is the futures side. Open interest rose 5% over two days while price went nowhere, and 75% of Binance accounts are positioned long. Over the past day, orders worth $10,000 or more showed net selling, while smaller orders showed net buying. Long liquidations appear to be clustered between 96.8 and 99.0, so losing 98.6 could trigger a sharp drop in one go.
The US rate decision comes out at 3 a.m. on the 29th, Korea time, followed by PCE inflation data that evening. Volatility could pick up around both releases.
In the end, I'm personally leaning toward 98.6 giving way and a slide to 97.4–97.7, then to the September 15 low at 95.8. 97.7 is where the weekly 50 MA lines up with the March and May weekly highs, so price could pause there. On the other hand, a 4-hour close above the top of the range at 105.2 would invalidate the bearish view and put the daily 50 MA near 109.5 back in play.
Key resistance 105.2 (top of the 4-hour range, daily 20 MA)
Key support 98.6 - 100.4 (lows on the 18th and 24th)
Next support 95.8 - 97.7 (weekly 50 MA, September 15 low)
The real signal isn't the round number 100 — it's whether we get a close below 98.6.
 XRP
 MARKET
 ETH