Two FOMC Votes for a Hike — Could Bitcoin Slide to the 77K Area if 79.2K Breaks?
 Coinyong
 BTC
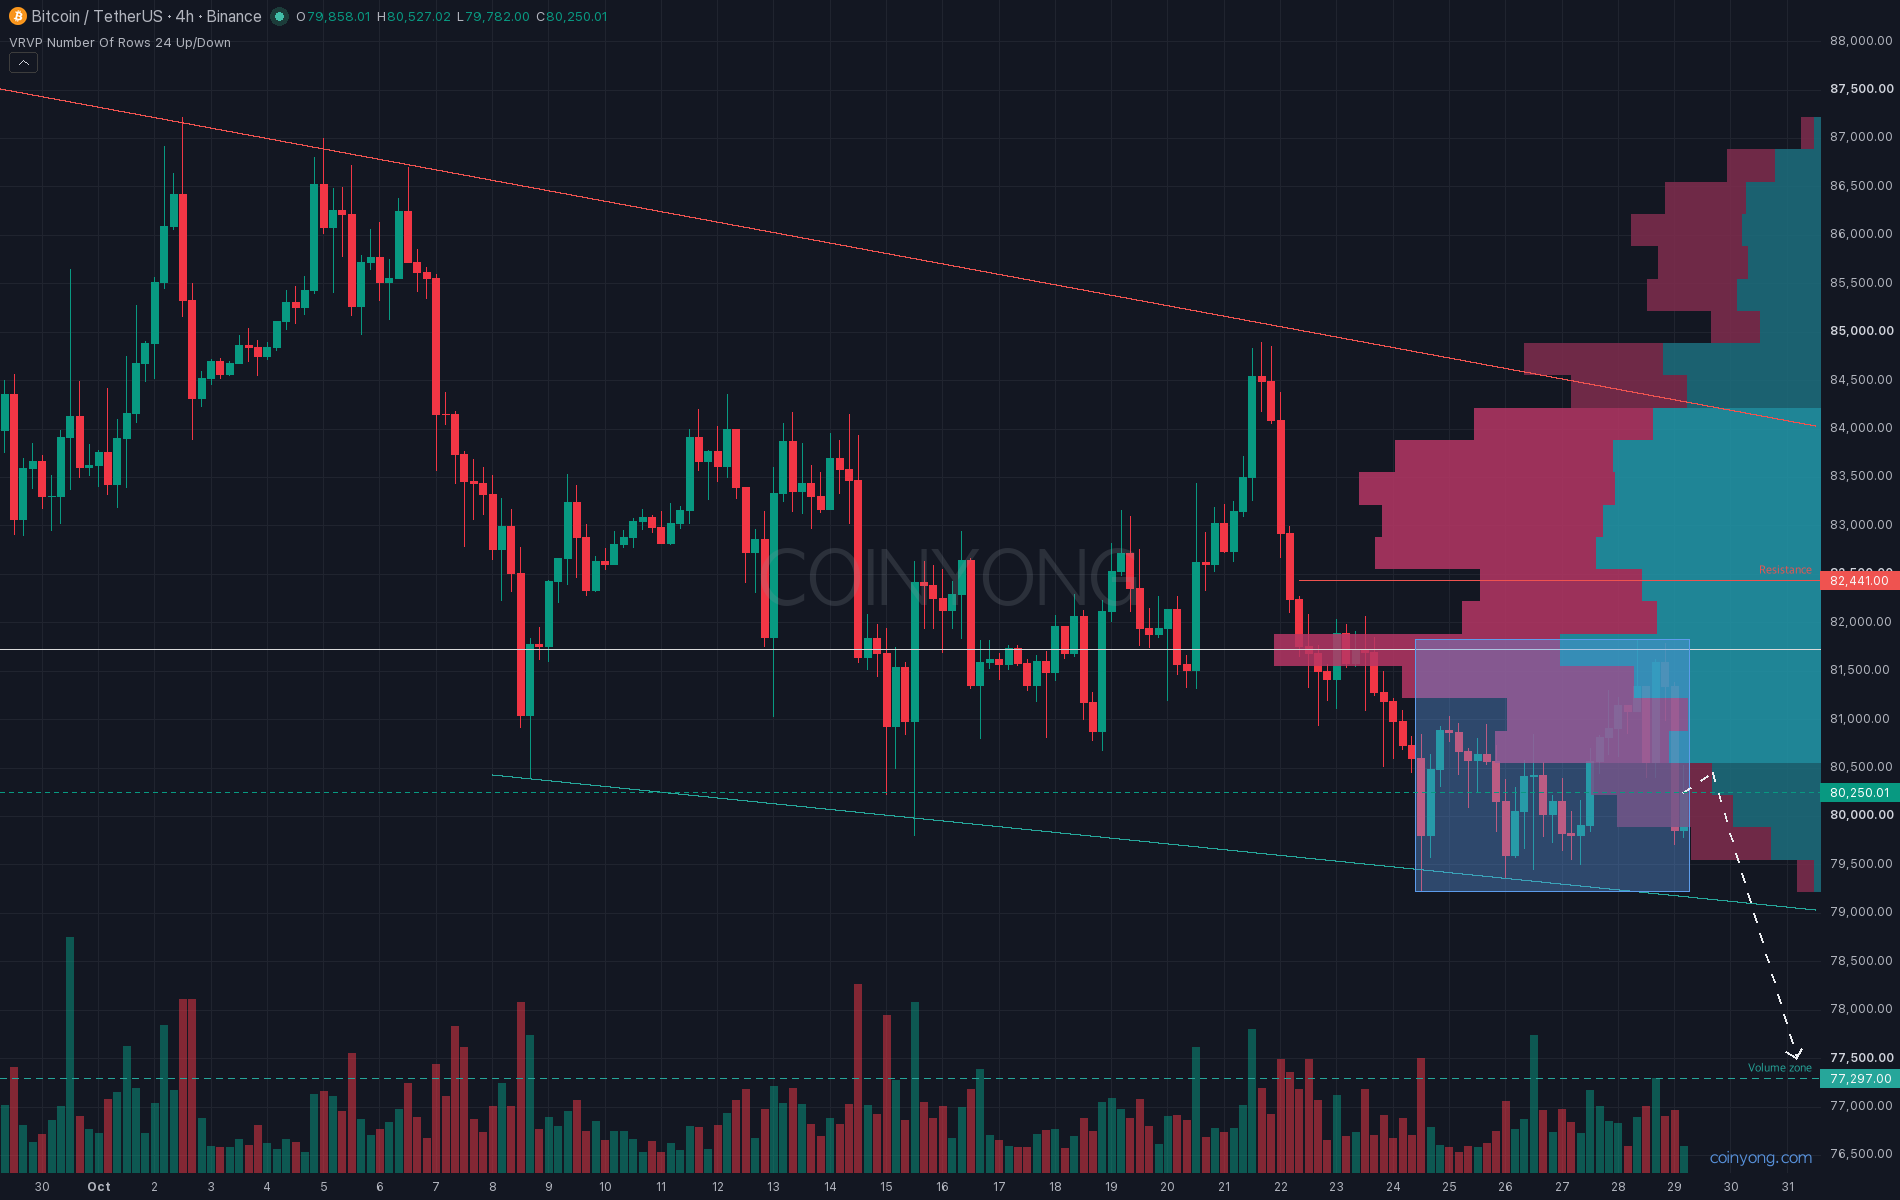
The Fed held rates, but both dissenting votes were for a hike. At 3 a.m. on the 29th, Korea time, the FOMC kept the policy rate at 3.75–4%, while Governor Cook and President Hammack argued for a 0.25-percentage-point increase. Bitcoin then slipped below 80K this morning — will it give up 79.2K this time?
This is the BTC 4-hour chart. Since last weekend, price has been moving inside a 79.2K–81.8K range, and this morning's 9 a.m. candle dropped from 81.3K to close at 79.9K in one move. That single candle wiped out the small uptrend that took price to 81.8K on Wednesday.
A lot lines up at the range bottom of 79.2K. The support line connecting the early-October and October 26 lows is passing near 79.2K right now, and the largest bid wall on the futures order book (about $60 million) also sits at 79.2K. Long liquidations are clustered just below at 79K and 78.1K, so a break here could speed up the decline.
Overhead looks heavy. Every 4-hour moving average from the 20 to the 200 is above price, and the zone with the most trading over the past month, 81.6–81.9K, overlaps with the top of the range. Over the past day, large orders above $1 million were net sellers by more than $140 million.
In Monday's market update, I leaned toward 79.2K giving way this week and a slide to the 77–78.4K volume zone. Instead, price held at 79.5K on Tuesday, bounced to 81.8K on Wednesday, and is back below 80K today.
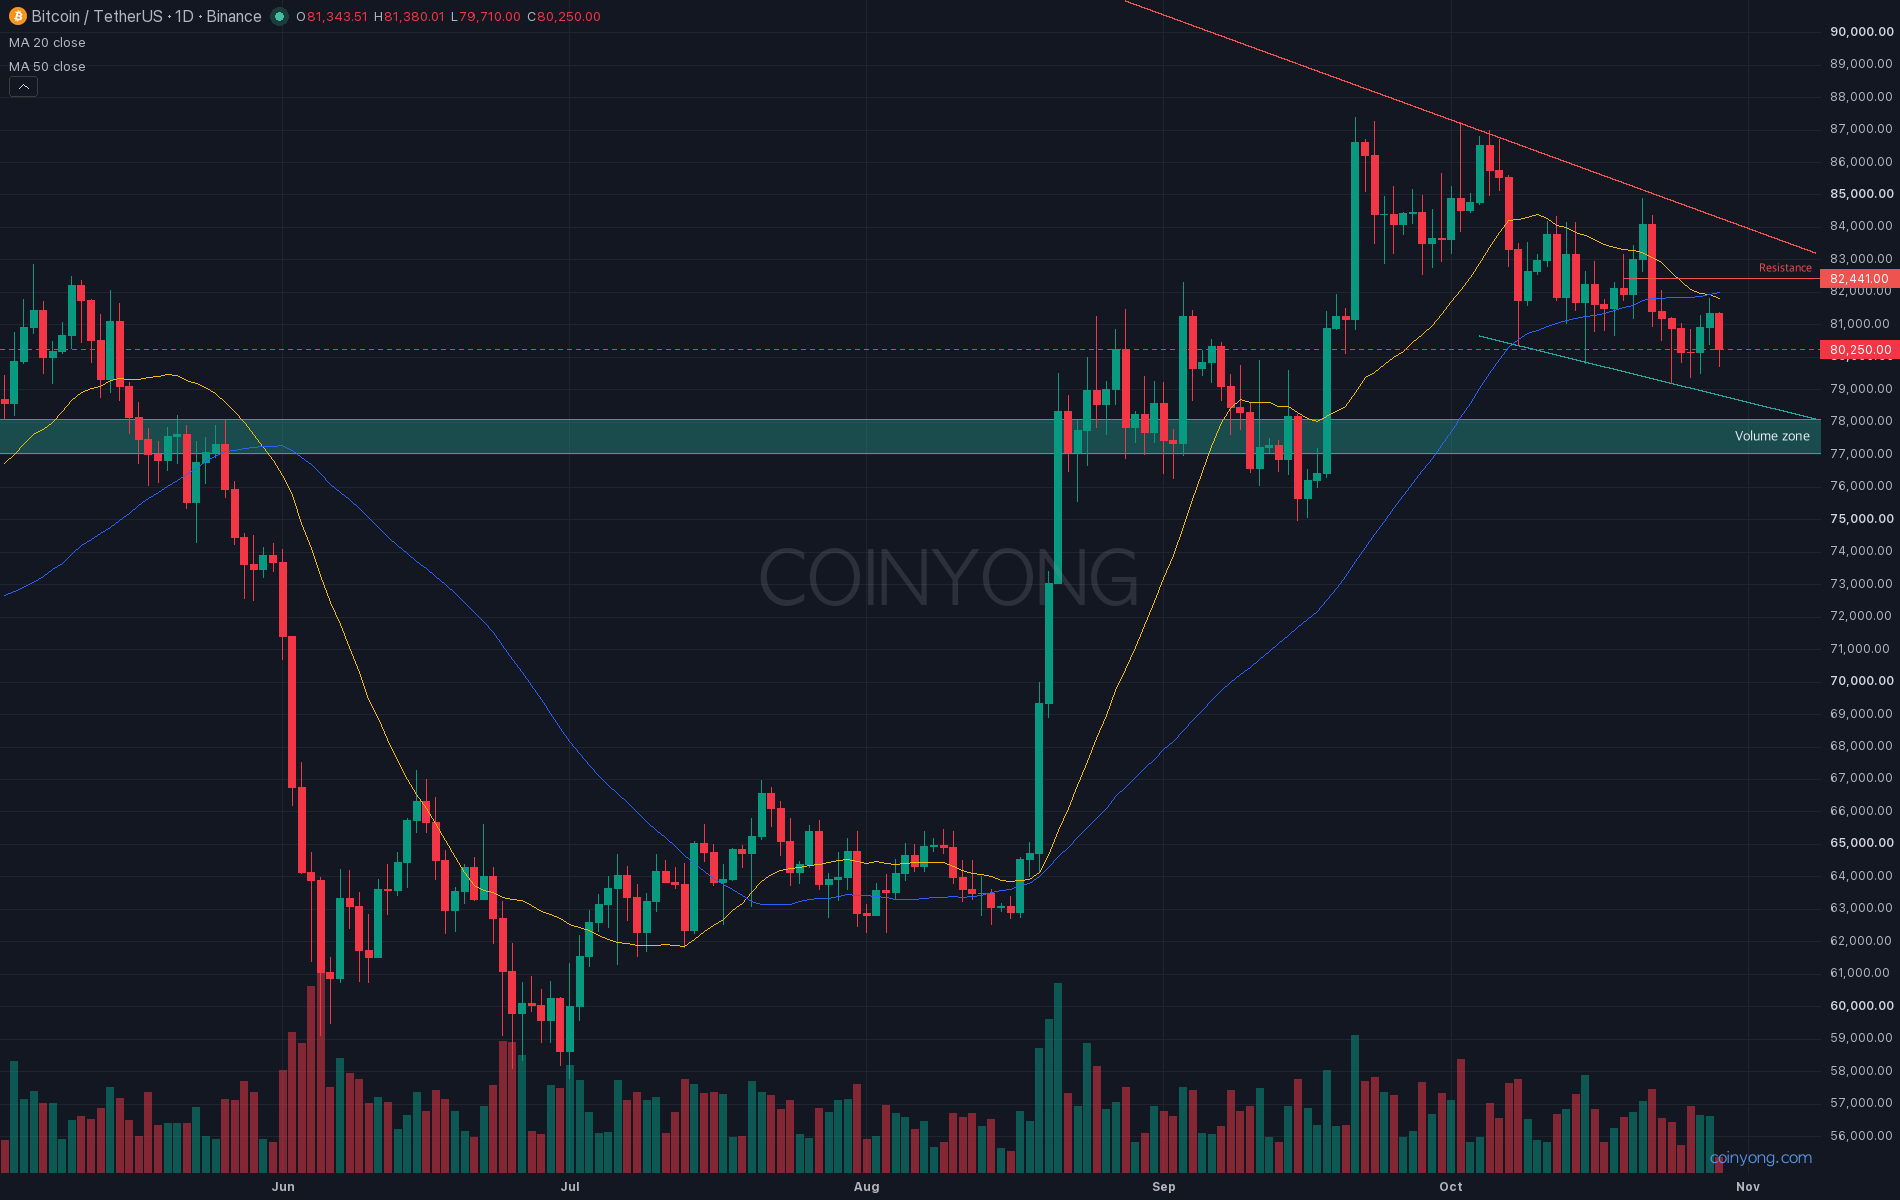
This is the BTC daily chart. The one-year downtrend line from last October's all-time high is now passing through 84.3K, and the October 21 high of 84.9K turned down near that line. Since the start of October, highs have stepped down from 87.2K to 84.9K to 81.8K, and lows from 80.4K to 79.8K to 79.2K. The daily 20-day and 50-day moving averages also overlap at 81.9K, capping the bounce.
There is evidence on the other side. US spot Bitcoin ETFs reportedly saw more than $300 million in net inflows over the 27th and 28th, and orders sized between $100K and $1 million showed about $70 million in net buying. But open interest actually dipped slightly while price fell, suggesting long unwinding is outpacing new buying.
In the end, I think a 4-hour close below the range bottom at 79.2K opens the way to 77–78K, the center of the 80-day volume zone. Personally, I'm leaning toward that level giving way after tonight's PCE release. On the other hand, a daily close above 82.5K would invalidate this view and put another test of the 84K area, where the one-year downtrend line sits, back in play.
Key resistance 81.8K - 82.5K (top of the range, one-month volume zone)
Key support 79K - 79.2K (range bottom, support line, bid wall)
Next support 77K - 78K (80-day volume zone)
With PCE and GDP data due at 9:30 p.m. Korea time tonight and month-end options expiring tomorrow, the first thing to watch is whether 4-hour candles can hold above 79.2K.
 DOGE
 SOL
 XRP