Bitcoin's October Monthly Candle Closes as a Bearish Engulfing — Which Levels Matter Now?
 Coinyong
 BTC
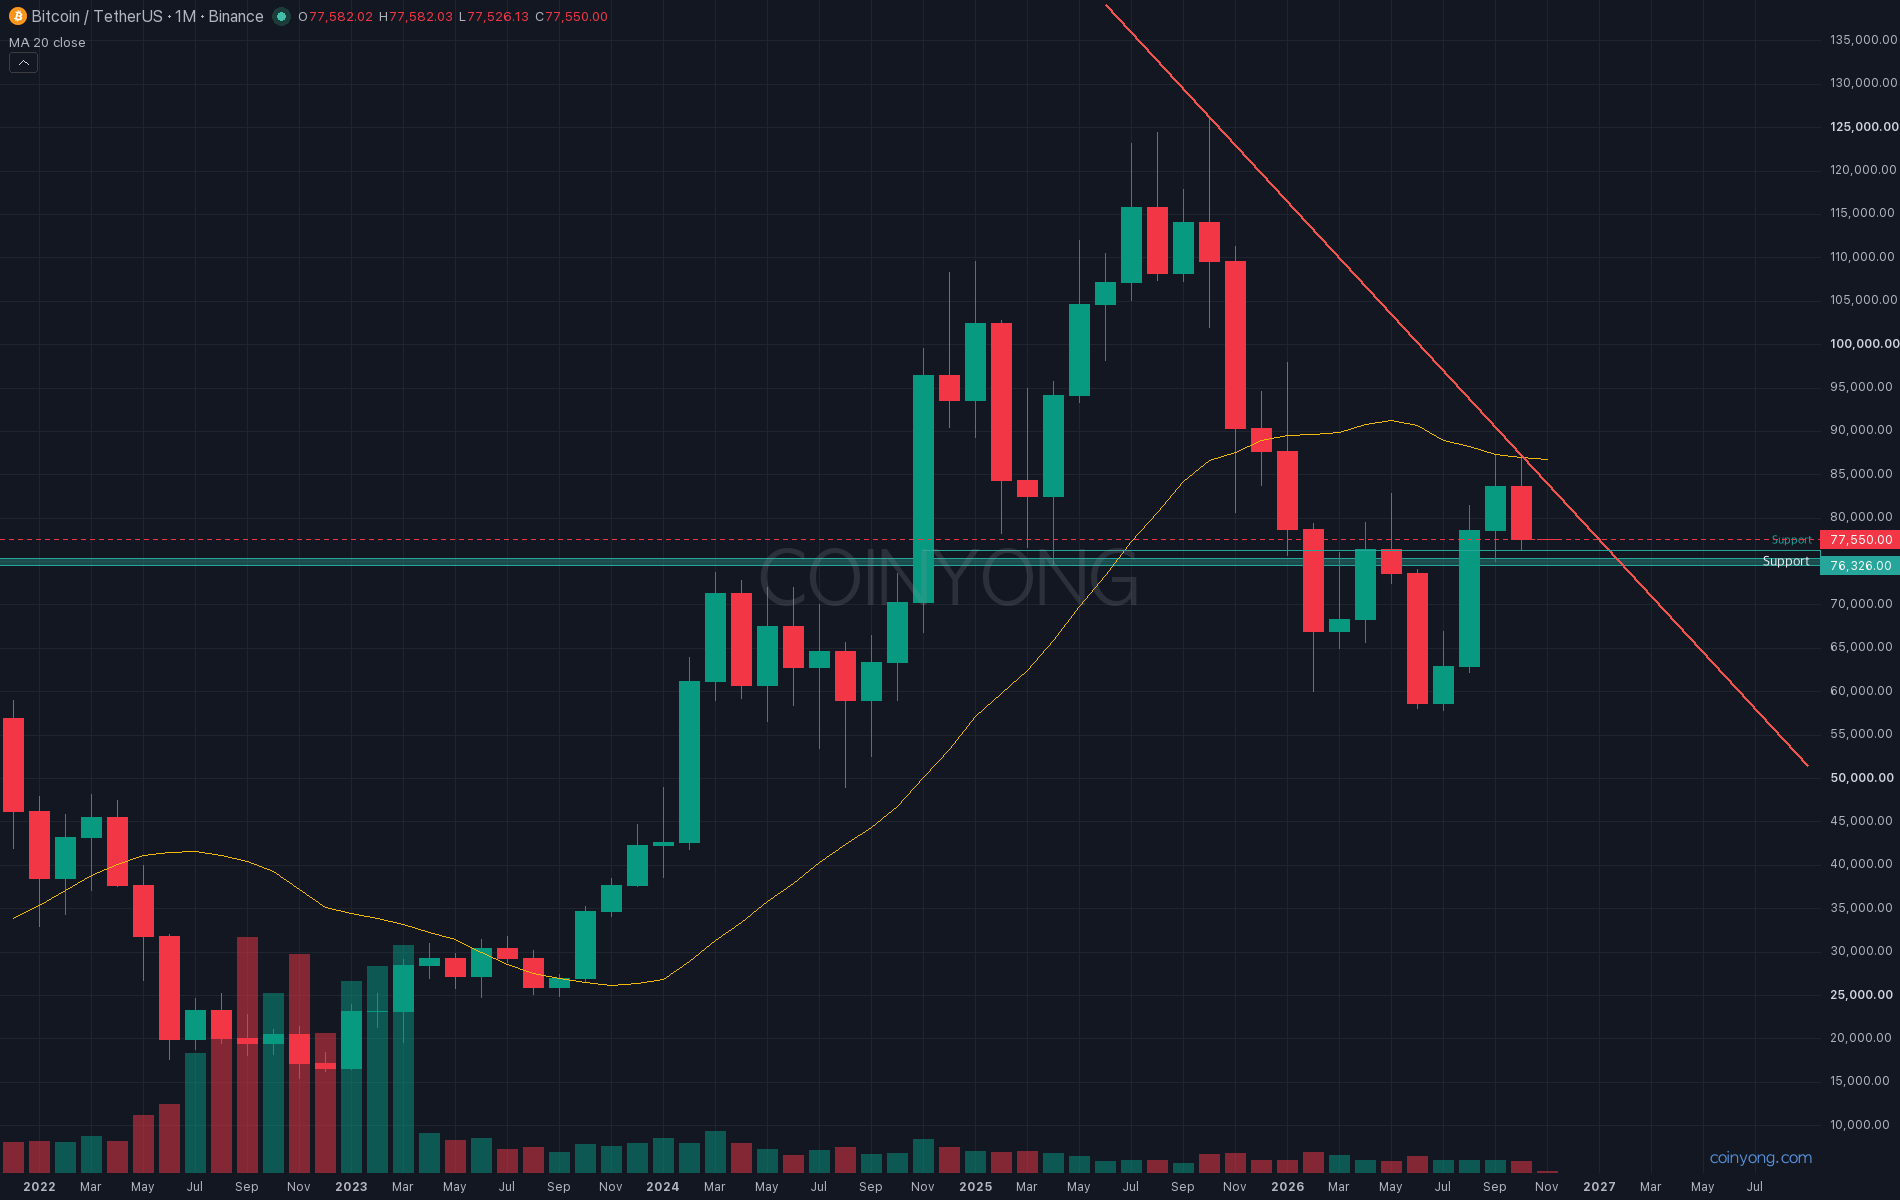
The October monthly candle closed at 9 a.m. today, Korea time. Bitcoin (BTC) opened the month at 83.6K and finished at 77.6K, down 7.2%, and this single red candle covered September's entire green body (78.6K–83.6K). That's a bearish engulfing on the monthly chart. So where could a bounce come from in November?
This is the BTC monthly chart. September's high of 87.4K and October's high of 87.2K were both rejected right around 87K, where the monthly 20 MA sits. The one-year downtrend line from last October's all-time high also capped October's high right on the line. After being rejected at the same level two months in a row and closing with an engulfing candle, I expect overhead resistance to remain strong for a while.
There were two similar setups this year. The January monthly candle rallied to 97.9K before closing at 78.7K, and February fell 15%. May also topped at 82.9K and closed red, then June slid more than 20%. That said, October's volume was lower than September's and the second-lowest this year. Since this wasn't a red candle with heavy selling behind it, I'm not assuming it collapses all at once.
Over the weekend, the FBI officially named a North Korean hacking group as behind the Binance hack and said the stolen assets were mainly being converted into Ethereum. Binance said it had covered about 90% of the losses using its own funds. Fears over the withdrawal halt have eased somewhat, but how the stolen assets get disposed of remains to be seen.
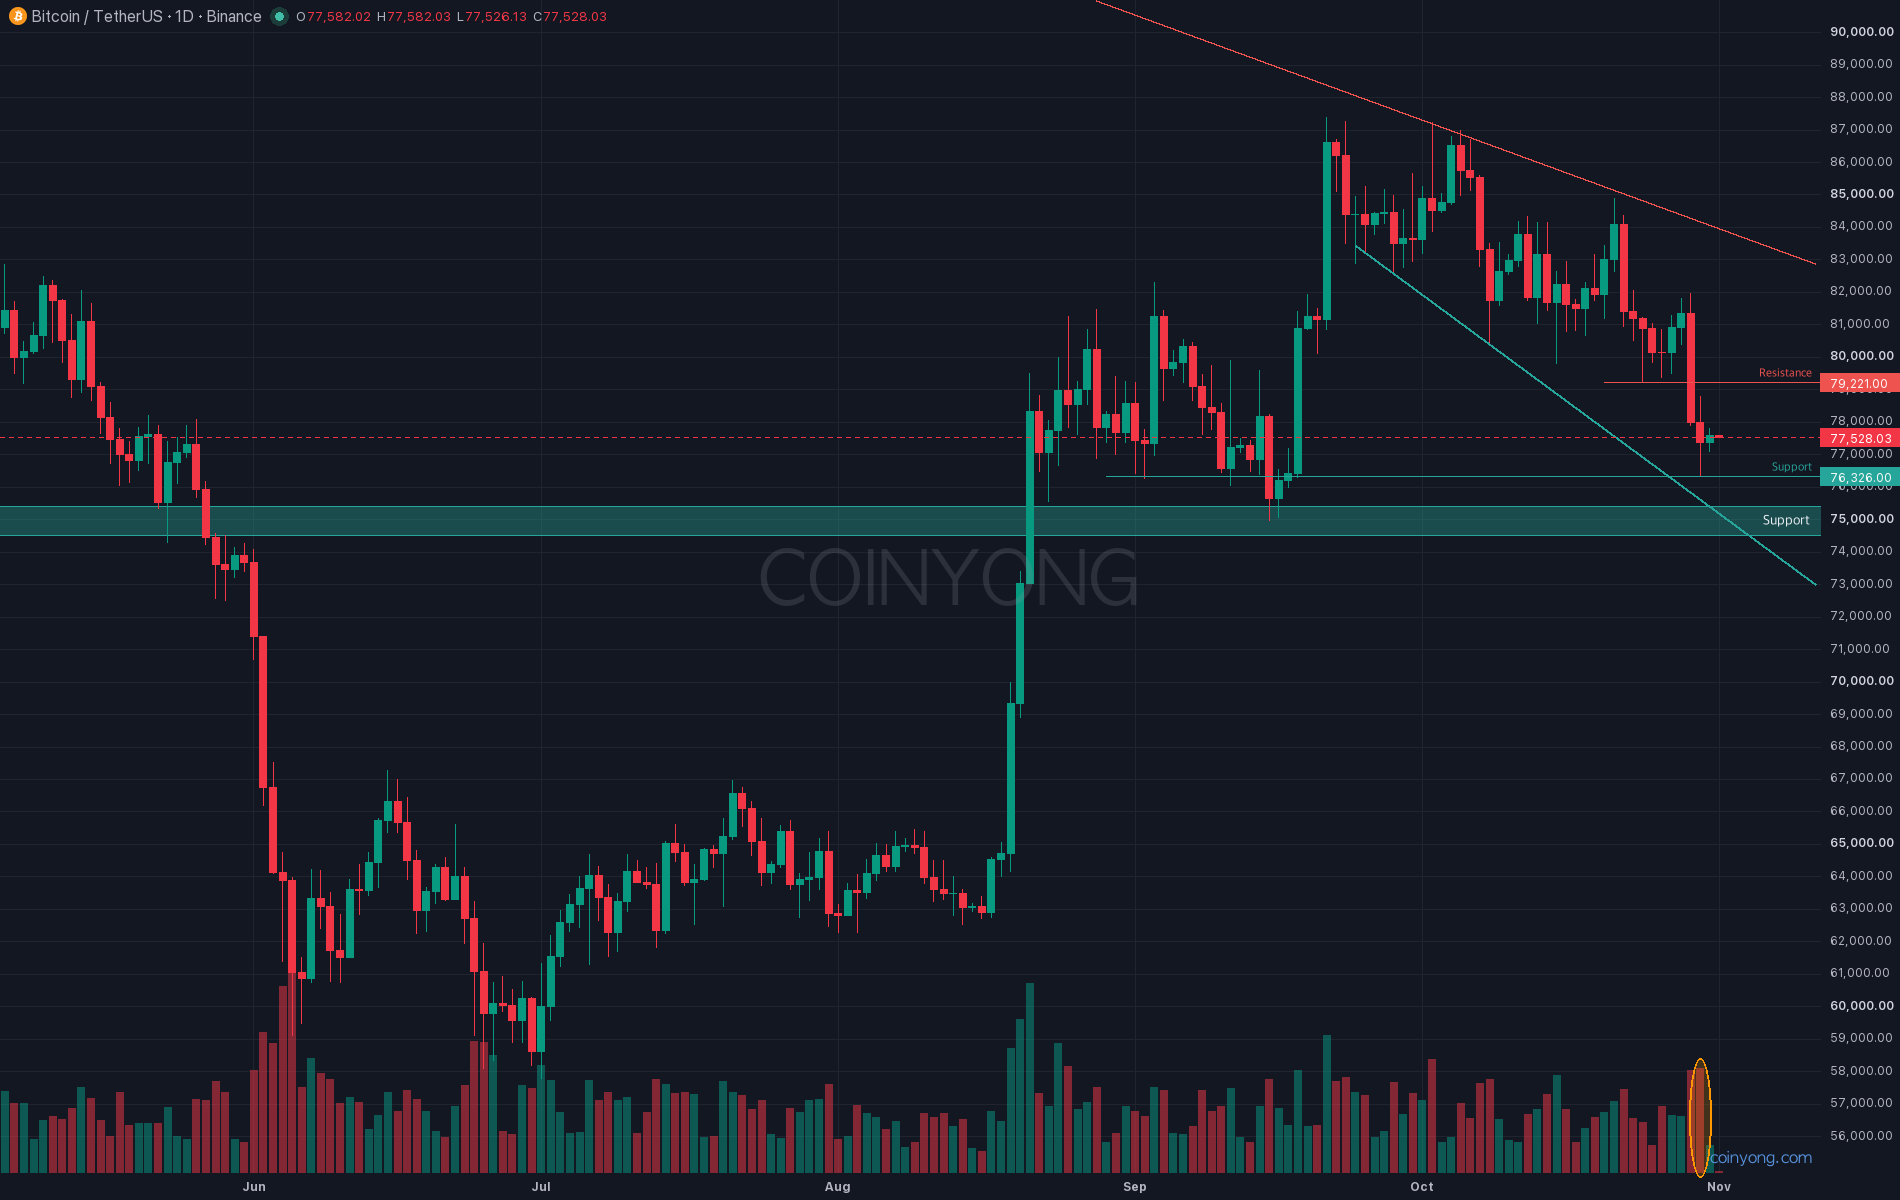
This is the BTC daily chart. Price is sitting just above 77.3K, where trading volume has been most concentrated over the past 80 days, and the level holding it up below is 76.3K. The September 2 and October 30 lows both stopped here, and the 100-day moving average also passes through 76.3K. The largest bid wall on the futures order book (about $50 million) sits at 76.5K too.
In my last post, I said a 4-hour close below 77K would open the way to 76.2K and 75K. Early on October 31, a 4-hour candle hit 76.3K and closed at 76.9K, then price returned to 77.5K.
What matters here is the strength of the bounce. Volume on the 4-hour candles that climbed from 76.3K is less than half the average of the previous 20 candles, and a sell wall of similar size is holding just above at 78.3K. Daily highs have kept stepping down from 87.4K to 84.9K to 82K, and the falling support line connecting lows since late September runs near 75K.
In the end, I think a daily close below 76.3K would open the way to 74.5–75.4K, where the September low of 75K and last April's low of 74.5K overlap. Long liquidations are clustered just below at 74.3K, so a break there could speed up the decline. Personally, with a monthly engulfing in place, I'm leaning toward a test of this zone in early November. On the other hand, a daily close above the broken range bottom at 79.2K would invalidate this view and put 84K, where the one-year downtrend line sits, back in play.
Key resistance 79.2K (broken range bottom)
Key support 76.3K (October low, 100-day MA)
Next support 74.5K - 75.4K (September low, last April's low)
Once the weekly candle also closes tomorrow morning, we'll know whether it's four red weeks in a row. Until the US jobs report on November 6, the first thing to check is the close relative to 76.3K.
 TRX
 LINK
 BNB