Chainlink Recovers 8% in a Day — Why the Broken Neckline at 11.9 Is Capping It
 Coinyong
 LINK
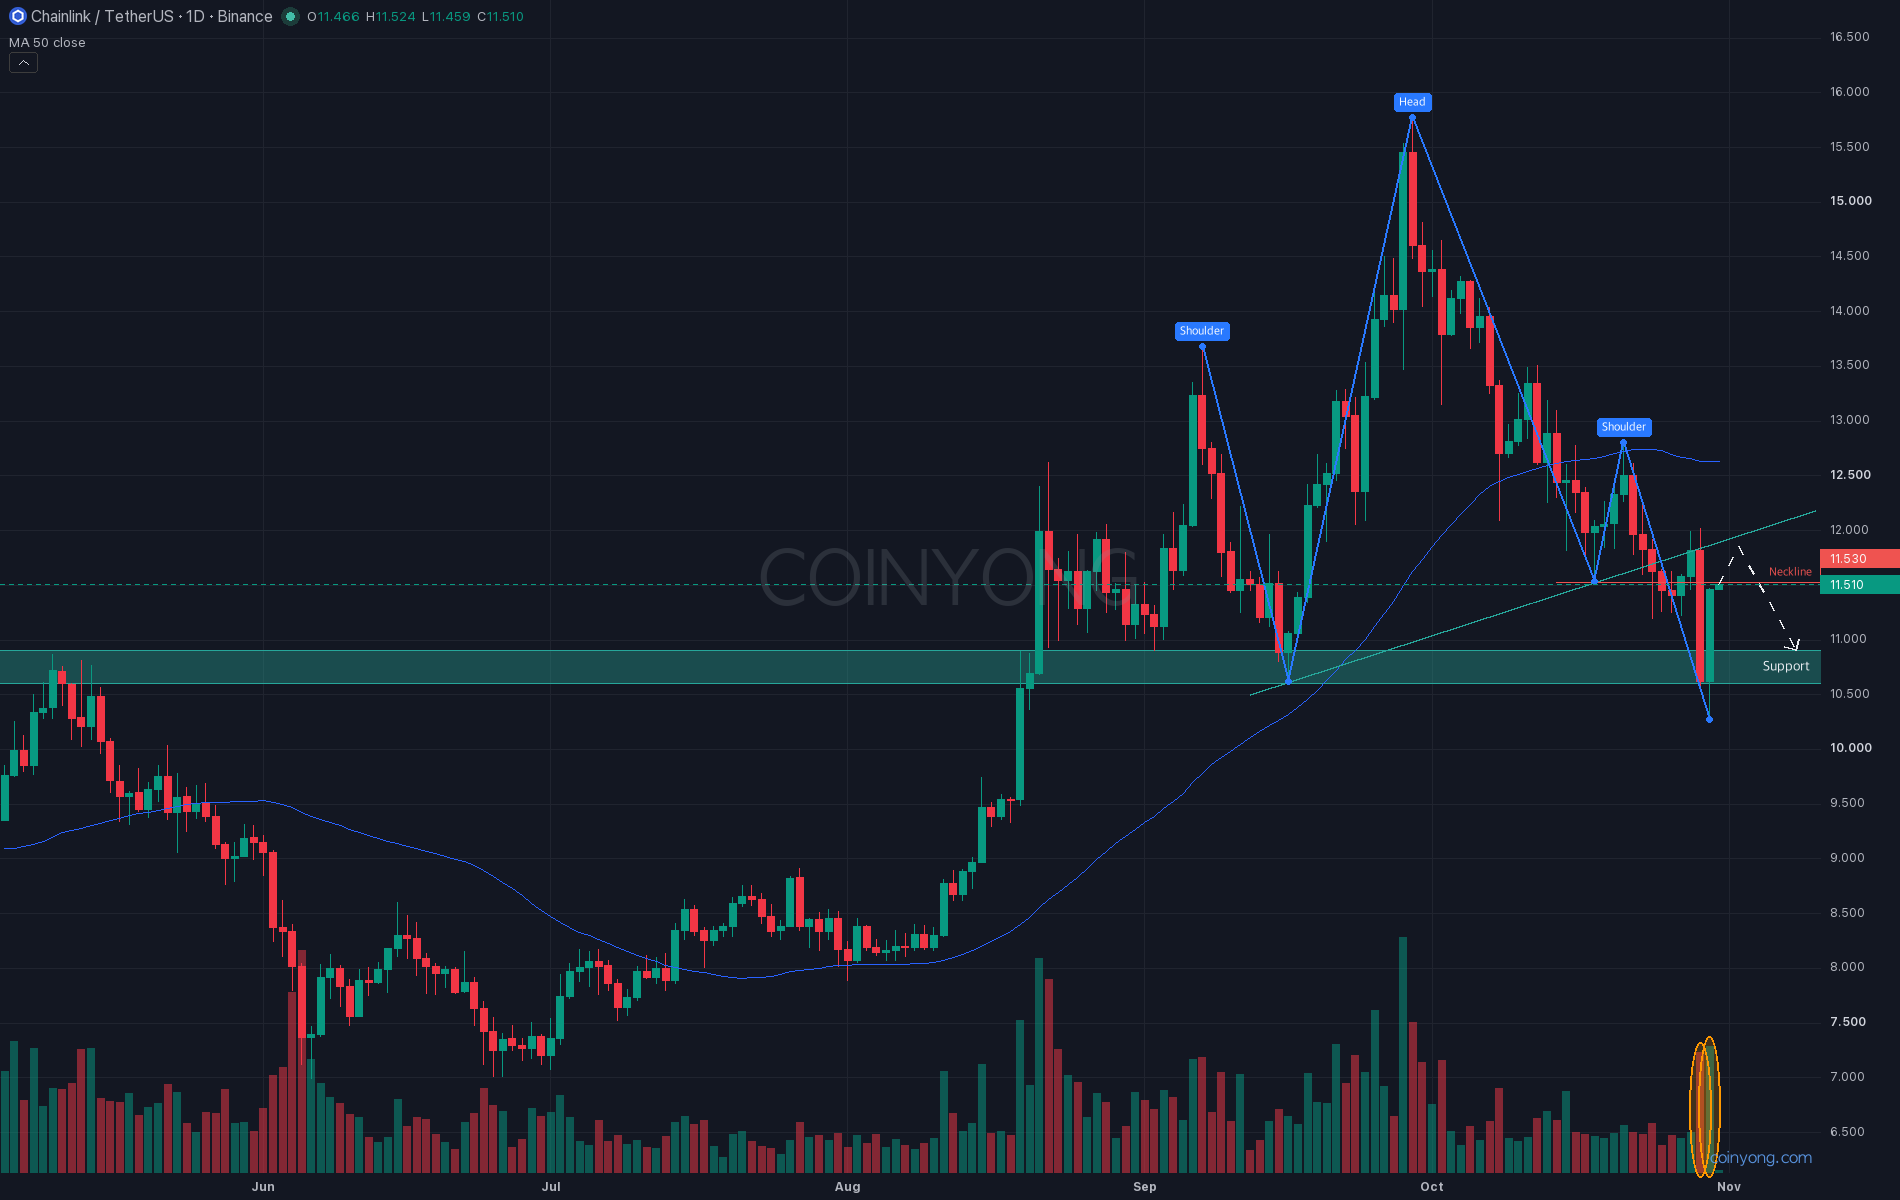
Chainlink (LINK), which plunged after Binance's security incident, has recovered almost all of the drop in a single day. Yesterday's daily candle fell as low as 10.27 before closing at 11.47, up 8%. So has it bottomed and turned around?
This is the LINK daily chart. There's a head-and-shoulders pattern formed by 13.69 on September 7, 15.78 on September 29 and 12.81 on October 21, and price closed below the 11.53 neckline on October 25. It briefly climbed back above the neckline on the 27th and 28th, but was rejected at 12.0 two days in a row, and the crash from the incident hit right at that level, dropping price to 10.27. At 11.5, price is back at that neckline, and the sloping neckline connecting the September 16 and October 18 lows also sits at 11.9 today.
Binance said the incident's impact was about $6.3 billion, and after briefly halting deposits and withdrawals, it said it would compensate users from its own fund. Altcoins bounced together over the same period, but USDT dominance rose from 6.74% to 6.99% and hasn't come back down. What matters here is whether new money came in on the bounce, and with the cash share still elevated, it's too early to say the market as a whole has started buying risk again.
For LINK, both the crash candle and the recovery candle came on 2.3–2.5 times the 20-day average volume. But a closer look at the rebound shows fading momentum. Open interest dropped from $94.7 million to $87.1 million during the crash and has only come back to $89.6 million, and while the past day's trades showed $2.3 million in net buying overall, large orders between $100K and $1 million showed $2.9 million in net selling.
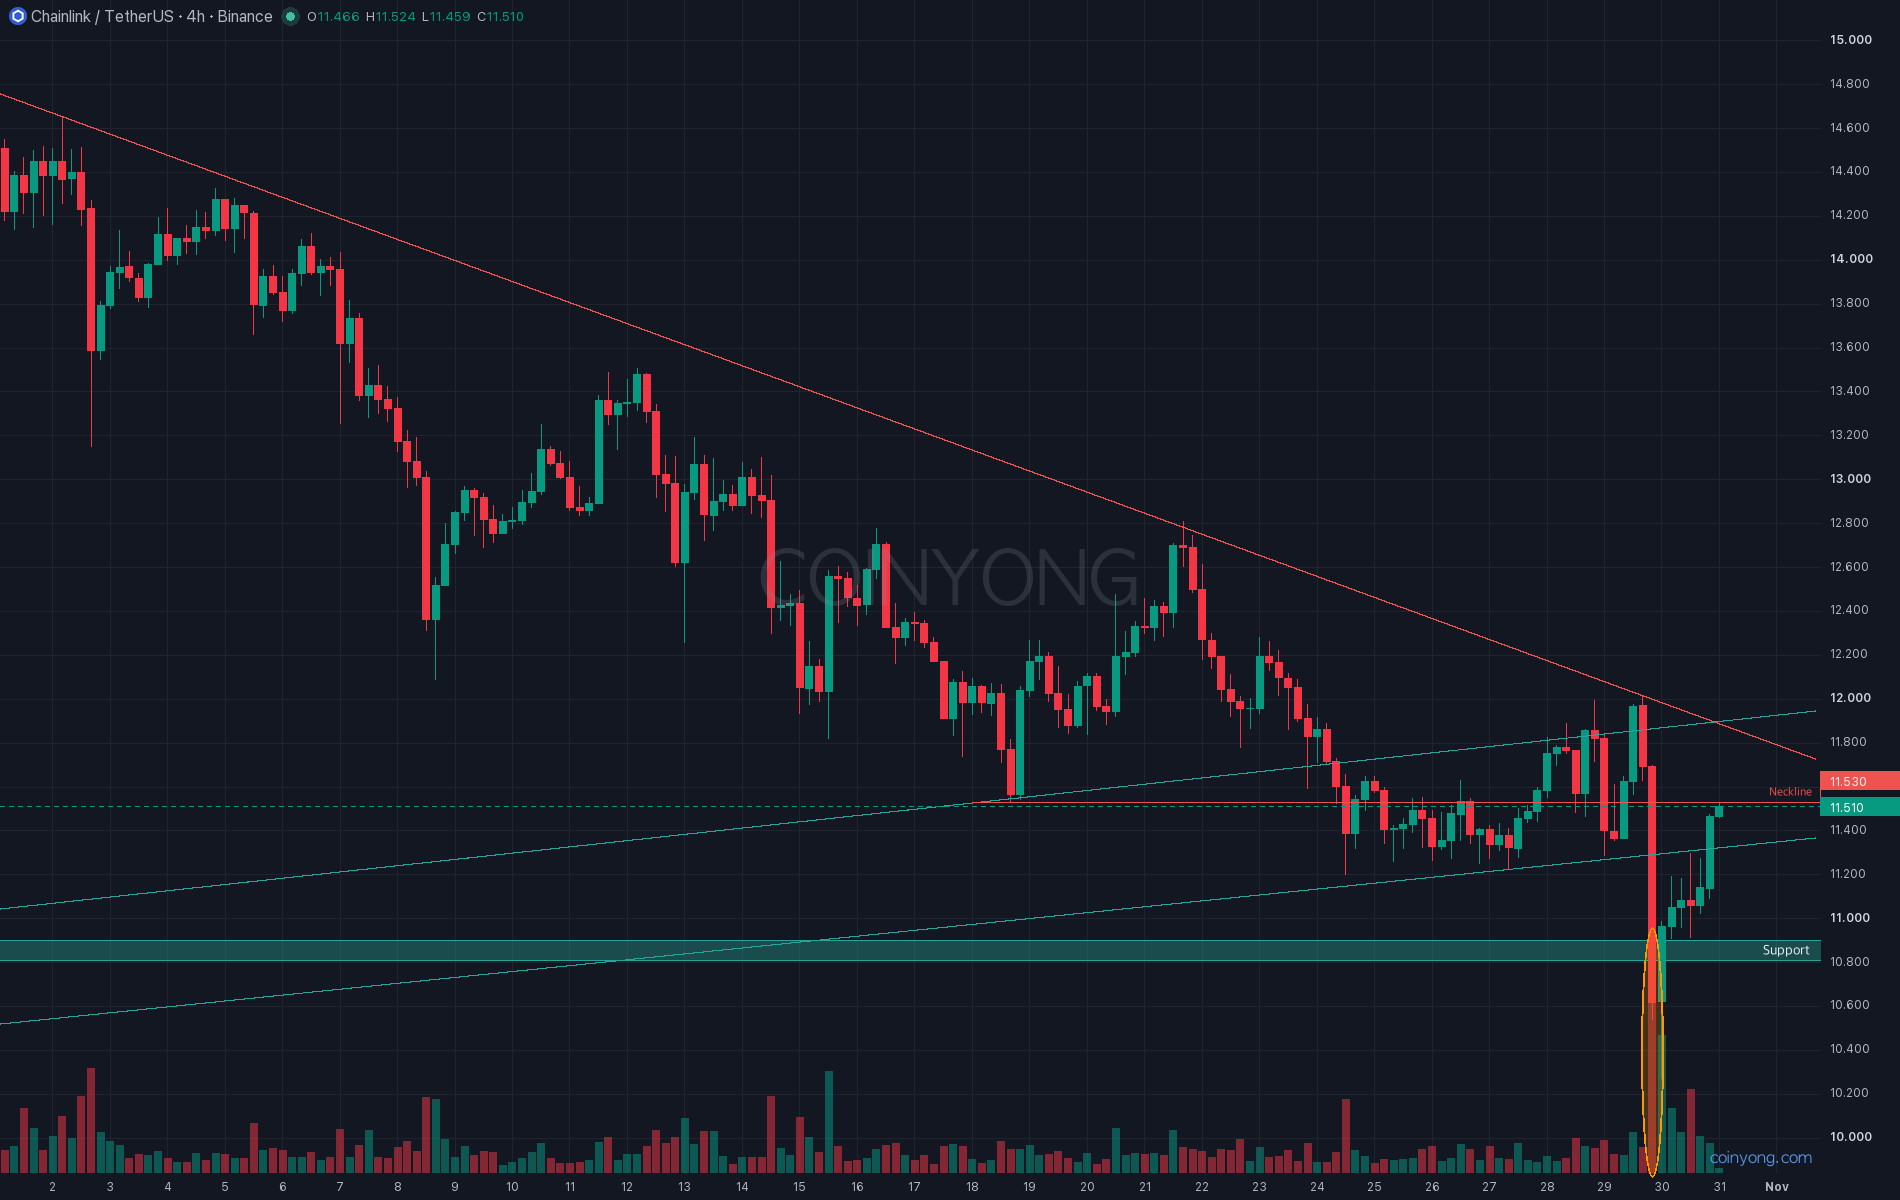
This is the LINK 4-hour chart. The downtrend line that started at 14.81 on September 30 has capped highs throughout October, and it was also this line that stopped the bounce to 12.0 on the 28th and 29th. Today it passes through 11.89, and the daily sloping neckline that price briefly reclaimed and then lost again, along with the 4-hour 100 MA, also converge at 11.9. Volume on the rebounding 4-hour candles has shrunk as price rose, with the last candle at only 0.6 times the 20-candle average.
Below, the uptrend line that has run since August sits at 11.33. It broke briefly during the incident but price is back above it now, so the first warning sign would be a 4-hour close back below that line.
In the end, I think this bounce is more likely a pullback retesting the broken neckline from below. Personally, I'm leaning toward a rejection near 11.9, followed by a break below 11.33 and another drop into the 10.6–10.9 support zone. On the other hand, a daily close above 11.9 would invalidate this view, and I'd need to keep the door open to 12.6, where the 50-day MA sits.
Key resistance 11.5 - 11.9 (broken neckline, downtrend line)
Near-term support 11.33 (August uptrend line)
Next support 10.6 - 10.9 (September low)
Incident low 10.27
The first thing to check is whether the October monthly candle closes above 11.9 at 9 a.m. tomorrow, Korea time.
 BNB
 ETH
 BTC