Tron Gives Back Its Spike in a Day — Could It Slide to June's 0.31 Floor?
 Coinyong
 TRX
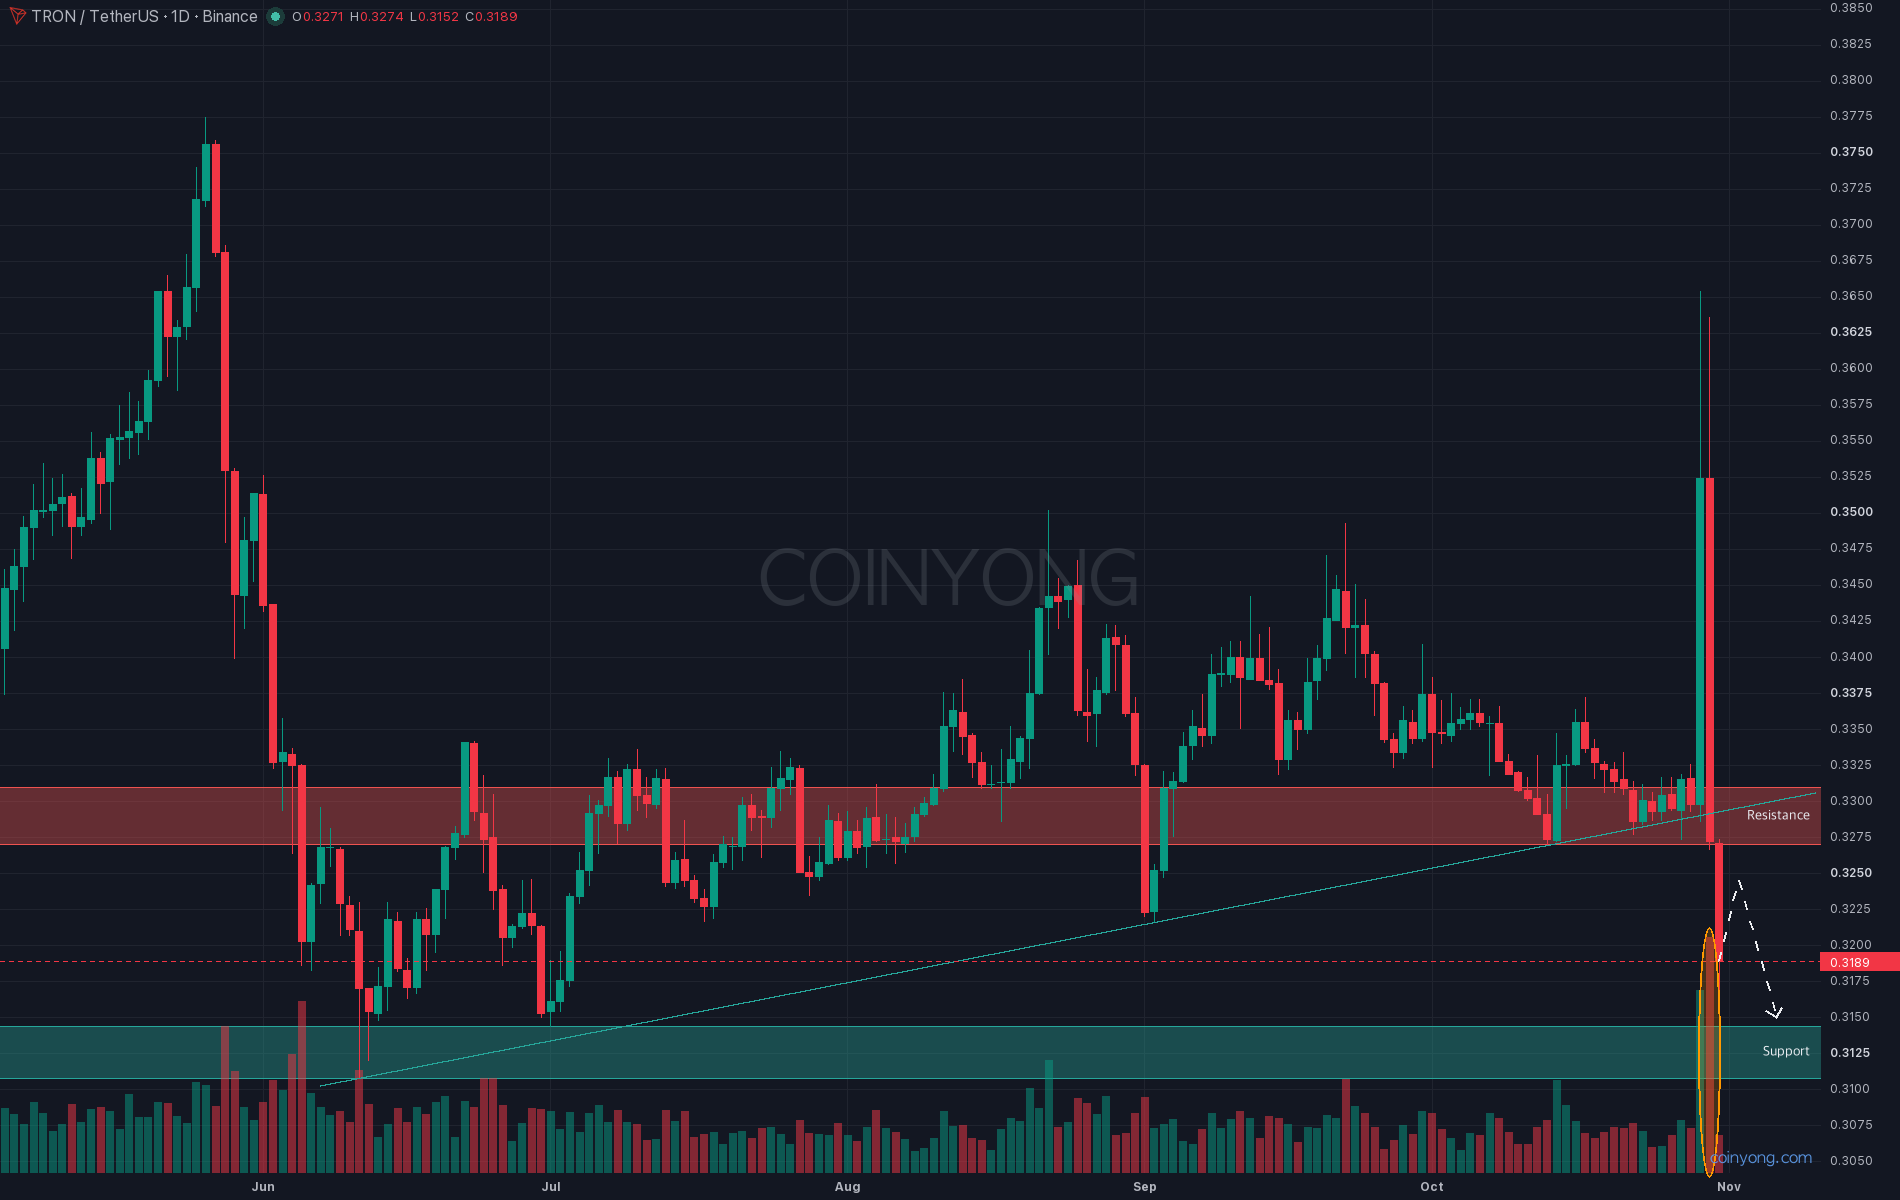
Tron (TRX) has swung hard in both directions over two days. On the 29th, the daily candle shot up to 0.3654, outperforming the rest of the market, but the next day gave back the entire gain, and today it has dropped to 0.315. So where does it stop?
This is the TRX daily chart. The bearish candle on the 30th came on 3.85 times the 20-day average volume and closed at 0.3272, engulfing the previous day's bullish body entirely. That means the selling at the higher levels outweighed the buying, and what matters here is not the spike itself but what broke after it.
There was an uptrend line that started from the June 11 low at 0.3108 and supported the lows on September 2 and October 13. Price lost this line for the first time on the 27th, moved back above it on the spike, then fell back below. Highs since late September had already been stepping down to 0.3409 and 0.3372, and the spike on the 29th couldn't hold into the next day's close.
The 0.327–0.331 zone is now acting as resistance. The October 13 floor, the broken trendline and the 0.329–0.333 high-volume node, which saw the heaviest trading over the past nine months, all overlap here. The daily 20-, 50-, 100- and 200-day moving averages are also bunched at 0.332–0.335, so even if a bounce comes, this level won't be easy to clear.
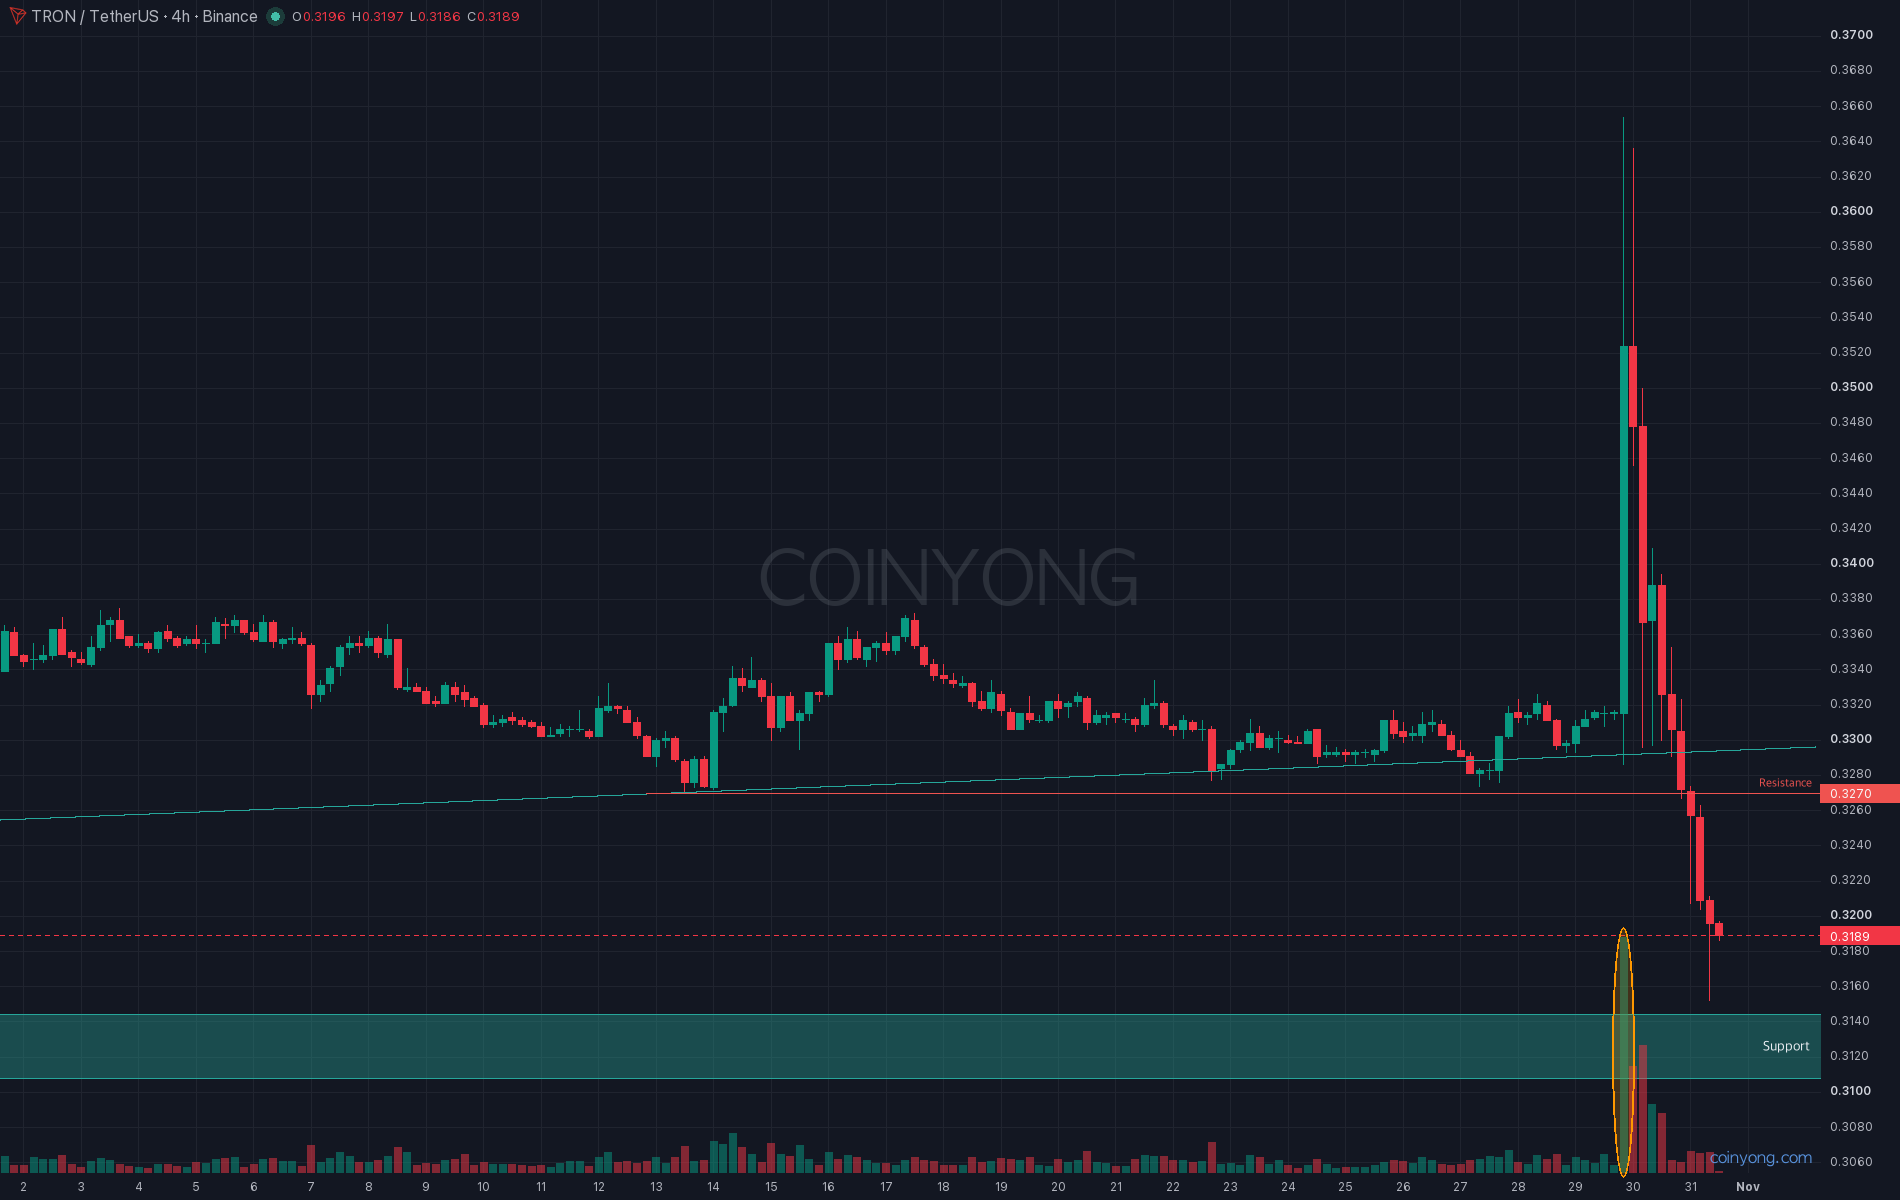
This is the TRX 4-hour chart. The 0.327 floor that held throughout October gave way this morning, and the 5 p.m. candle closed at 0.3196, below the September 2 low of 0.3217. Below, there's 0.3108–0.3144, where the June 11 and late-June lows cluster, and the bottom of the daily volume zone is also near 0.312, so personally, I'm leaning toward a slide into that zone.
The wild card is futures. Funding is deeply negative and open interest is about 12% higher than before the spike, so shorts are fairly crowded. The 4-hour Stochastic RSI is also in oversold territory, so a short bounce toward 0.325 is possible. But if that bounce can't settle above 0.327, there's little reason for shorts to cover.
In the end, Tron has lost the 0.32–0.33 support it had held since June, and I see the next level as the June lows around 0.31. A daily close above 0.33 would invalidate this bearish view, and I'd treat it as a return to the range. Conversely, a close below 0.3108 would mean the June floor has broken too, and I'd need to keep the door open to around 0.30.
Key resistance 0.327 - 0.331 (broken support, center of the volume zone)
Next support 0.3108 - 0.3144 (June floor)
The first check is whether the daily candle closes below 0.32 at 9 a.m. tomorrow, Korea time.
 LINK
 BNB
 ETH