Ethereum's Bounce Stalls at the Broken 2.3K Neckline — Could It Slide Below 2.2K?
 Coinyong
 ETH
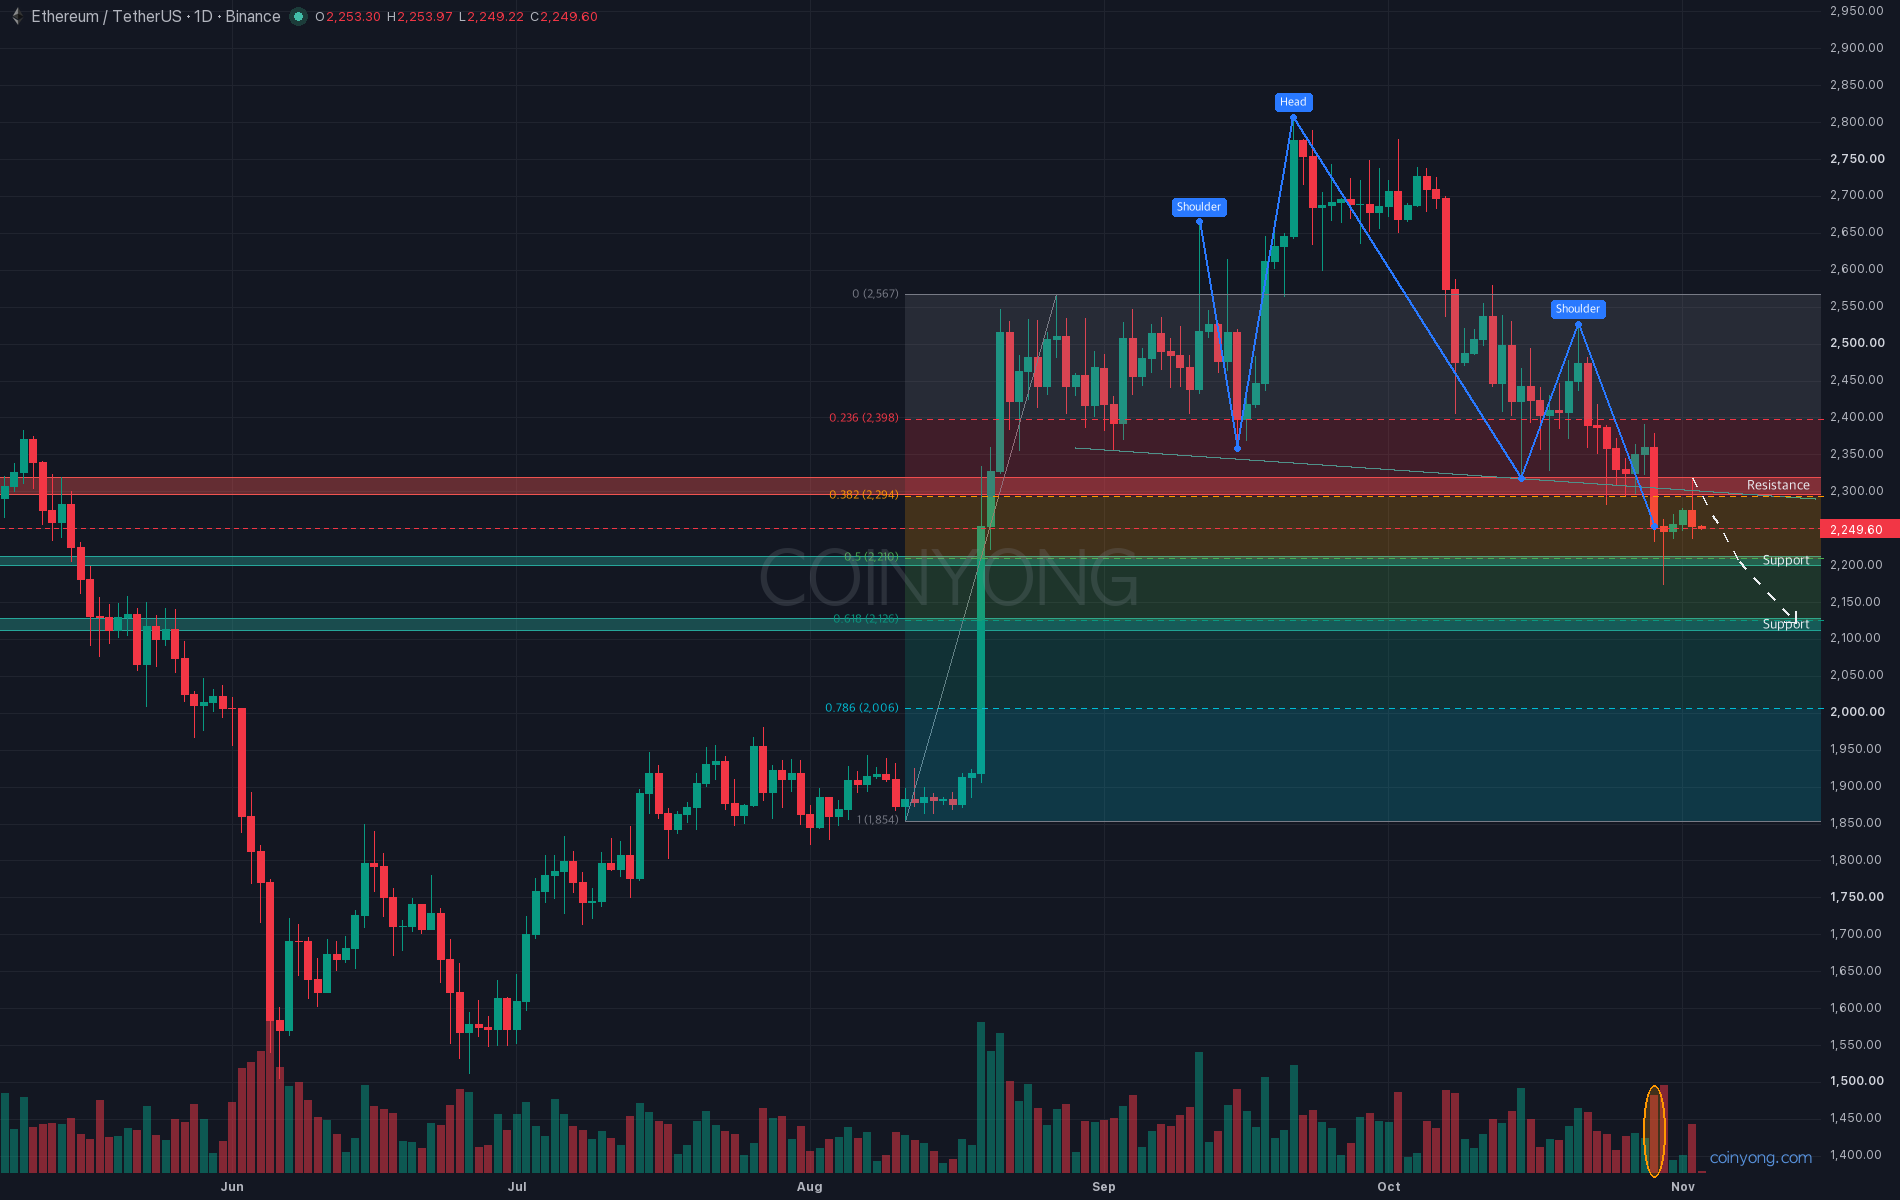
While Bitcoin gave up 77K amid the aftershocks of the Binance hack, Ethereum (ETH) actually bounced to 2.31K. But that bounce stalled right below the broken neckline — so can we read it as a sign of a move higher?
This is the ETH daily chart. The daily candle on October 29 broke the neckline of the head-and-shoulders formed by 2.67K and 2.81K in September and 2.53K in October, and yesterday's daily candle climbed to 2.318K before closing at 2.253K. The neckline connecting the September–October lows now passes through 2.30K, and the high only poked above it with a wick. Just above that, 2.32–2.37K is the volume zone where the most trading has built up over the past 260 days, creating heavy overhead resistance.
In my last post, I said continued 4-hour closes below 2.21K would lead to a test of 2.10–2.13K, and a daily close above 2.32K would invalidate that view. After the 2.17K low, there was no 4-hour close below 2.21K, and the bounce stalled just below the 2.32K invalidation level.
What matters here is the strength of the bounce. Yesterday's daily volume was only 1.05 times the 20-day average. Binance futures open interest rose slightly during the bounce, then fell 2% from its peak after the rejection at 2.32K, which means positions added during the bounce are already being unwound.
The broader market isn't in ETH's favor either. Over the past week, Tether dominance rose from 6.79% to 7.05%, and altcoin market cap (TOTAL3) shrank nearly 5%. ETH only fell about 1 percentage point less than BTC over the week, so it's hard to say money has rotated into ETH.
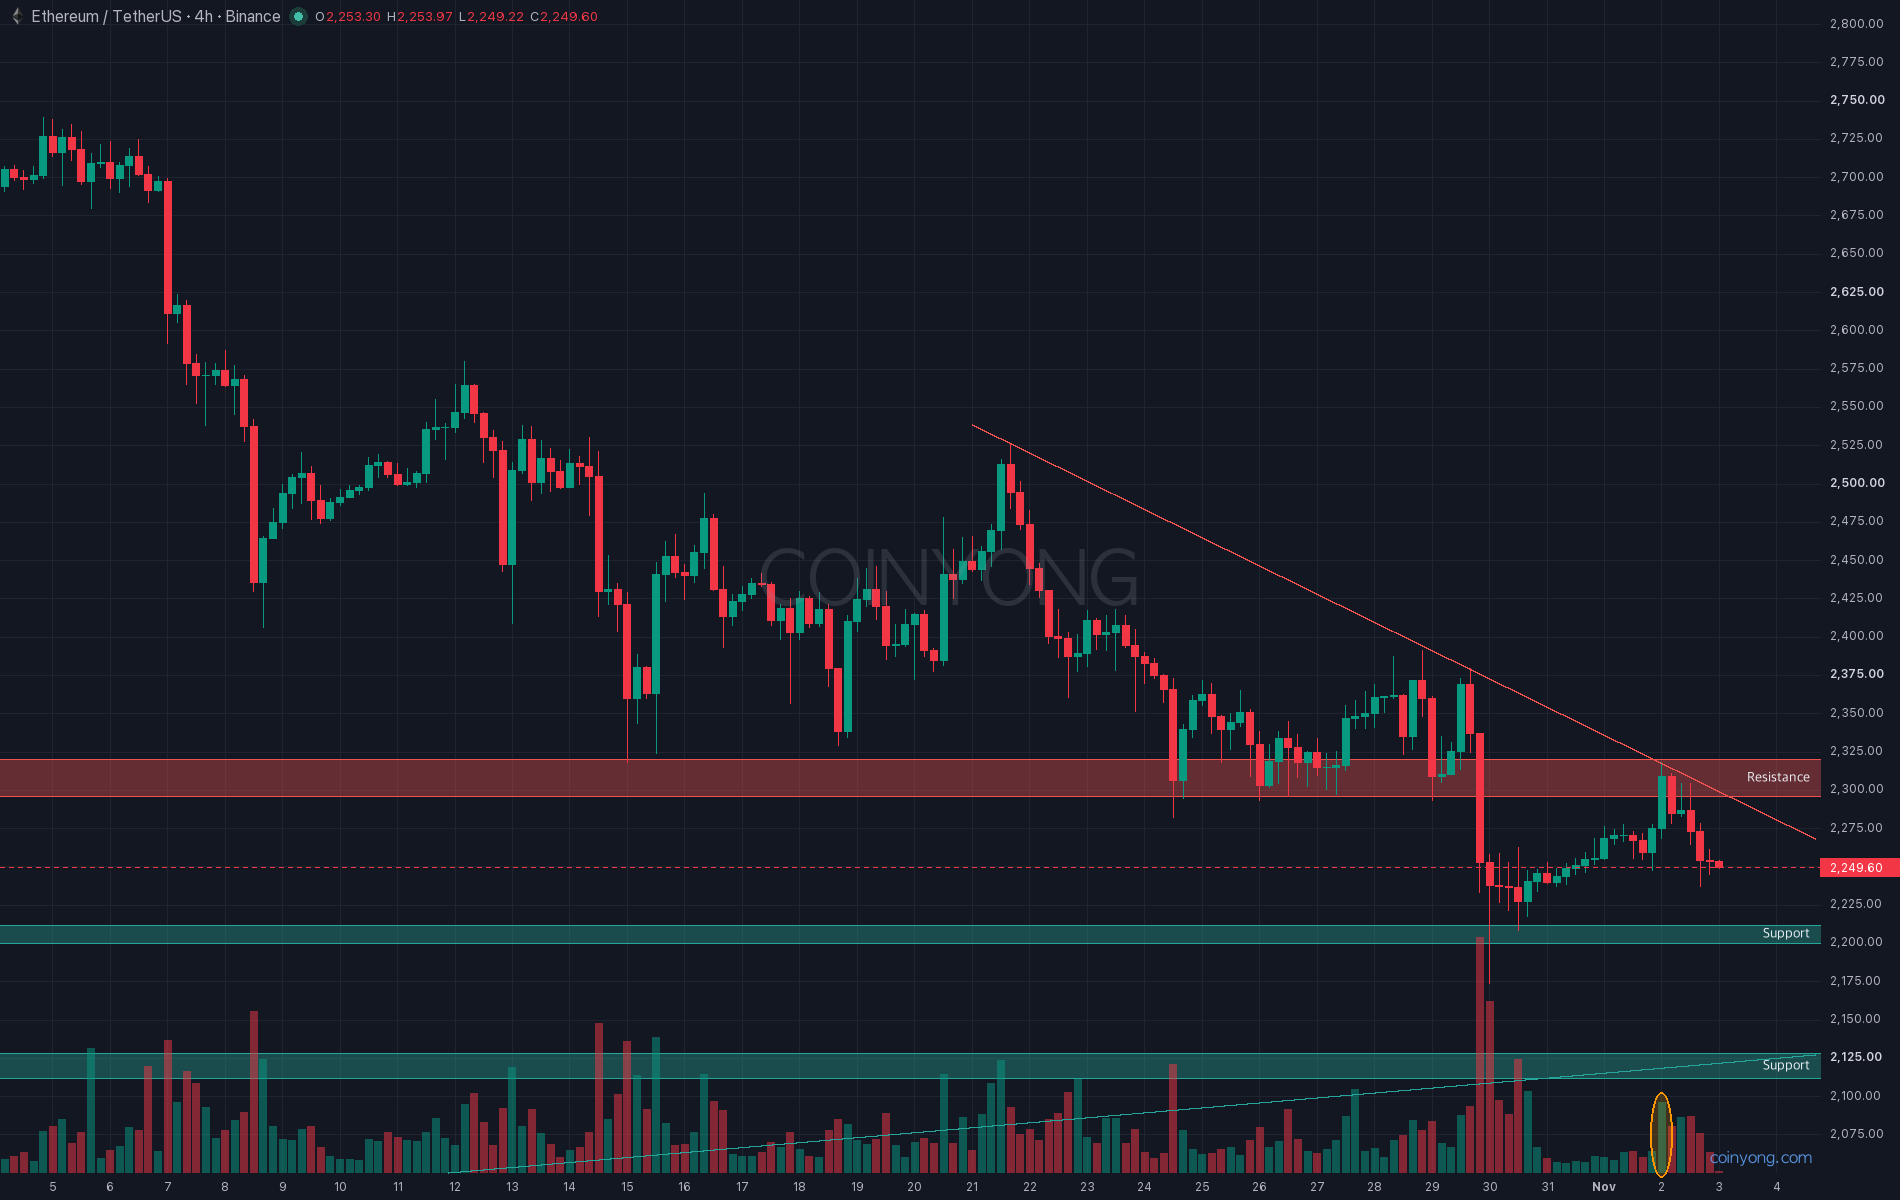
This is the ETH 4-hour chart. The downtrend line connecting the highs at 2.53K on October 21, 2.39K and yesterday's 2.32K now passes through 2.30K, and yesterday's bounce turned down exactly at this line. In other words, the broken neckline and the 4-hour downtrend line overlap at the same 2.30–2.32K level.
The next support level isn't far below. Measuring the rally from the August low at 1.85K to the late-August high at 2.57K with Fibonacci puts the 0.5 level at 2.21K, and the weekly 20 MA and long liquidations are also clustered around 2.20K. The 2.16–2.27K range is a low-volume zone, so if 2.20K gives way, price could slide quickly past the 2.17K low to 2.12K. 2.12K is where the Fibonacci 0.618 level, the 2.11K weekly low and the 4-hour rising support line that has run since August overlap.
In the end, since the bounce couldn't clear the broken neckline, I'm personally leaning toward another slide to 2.12K if a 4-hour candle closes below 2.20K. With the daily RSI at 32, another bounce from 2.17K wouldn't be surprising, but a daily close above 2.32K would invalidate this view, and 2.36–2.39K would come back into play.
Key resistance 2.30K - 2.32K (broken neckline, 4-hour downtrend line)
First support 2.20K - 2.21K (Fibonacci 0.5, long liquidations)
Next support 2.11K - 2.13K (weekly low, Fibonacci 0.618)
With the US midterm elections tonight and the jobs report on Friday this week, now is the time to first watch whether the 4-hour candle closes below 2.20K rather than hoping for a bounce.
More analysis
 MARKET
 BTC
 TRX