Binance Withdrawals Are Back, but Bitcoin Prints a Fourth Straight Weekly Loss — Could It Slide to 75K?
 Coinyong
 MARKET
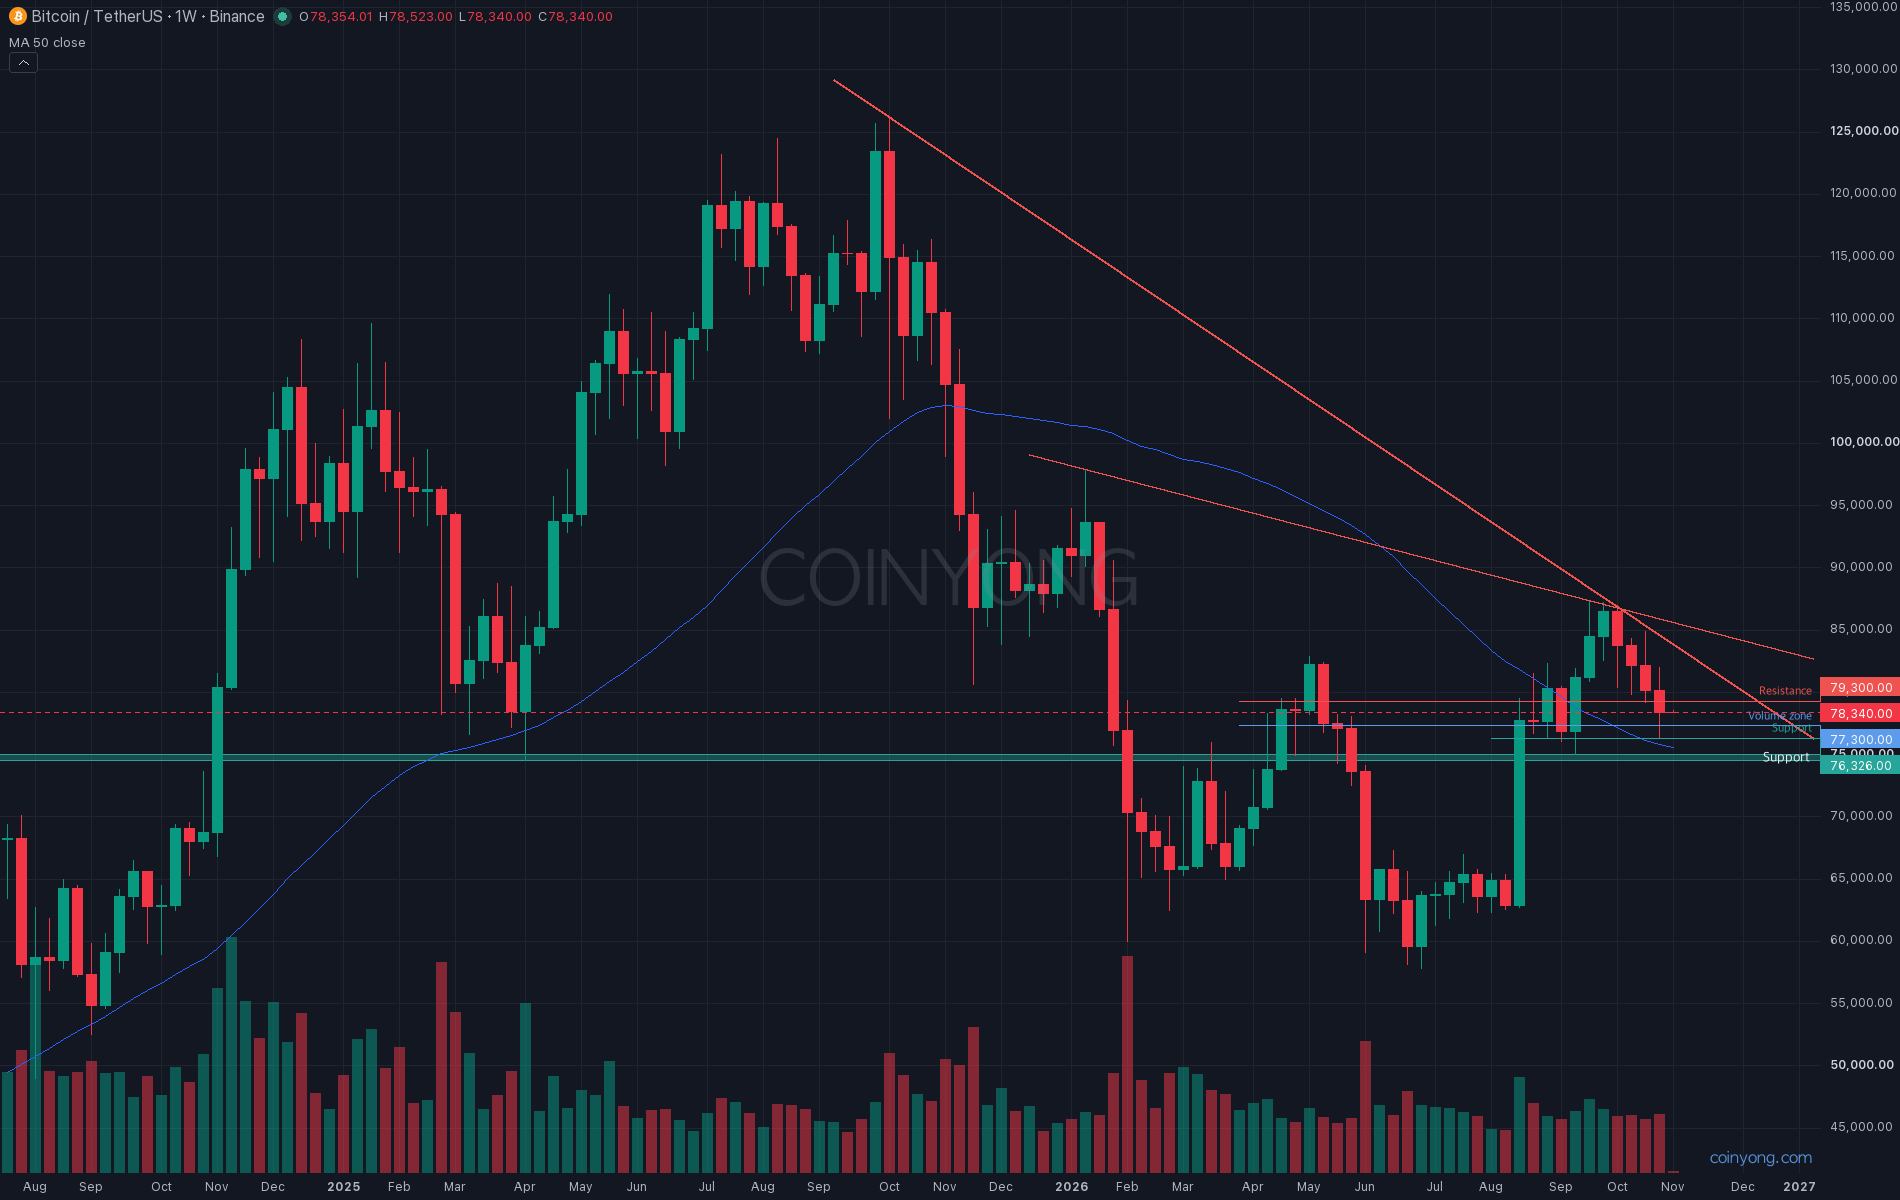
Bitcoin's weekly candle closed at 78.4K at 9 a.m. this morning, Korea time. The week opened at 80.2K, climbed to 82K, then slid to 76.3K on news of the Binance hack, making it four red weeks in a row. Binance reopened withdrawals on Sunday, so where will Bitcoin hold this week?
This is the Bitcoin (BTC) weekly chart. The downtrend line connecting the January and September highs passes through 85.6K this week, and the one-year downtrend line from last October's all-time high has come down to around 84K. October's weekly highs stepped down from 87K to 84.9K to 82K, and lows fell alongside them, from 79.2K to 76.3K.
Just below are the 77.3K volume zone, where the most trading has built up over the past 80 days, and the October 30 low at 76.3K. Below that are 75.8K, where the 50-week MA runs, and 74.5–75K, where last April's and this September's weekly lows overlap. This week's volume was about the same as the prior 20-week average, so the red candle wasn't driven by a surge in selling volume.
In last week's market update, I leaned toward 79.2K giving way and a slide to the 77K–78.4K volume zone. Within a day of the Binance incident becoming public, price dropped below that to 76.3K.
Binance disclosed $6.3 billion in unauthorized withdrawals on October 29, and on the 31st the FBI named a North Korean hacking group as the culprit. With withdrawals resuming in stages from the 1st, fears over the halt have eased somewhat. What matters here is where the money went after the incident.
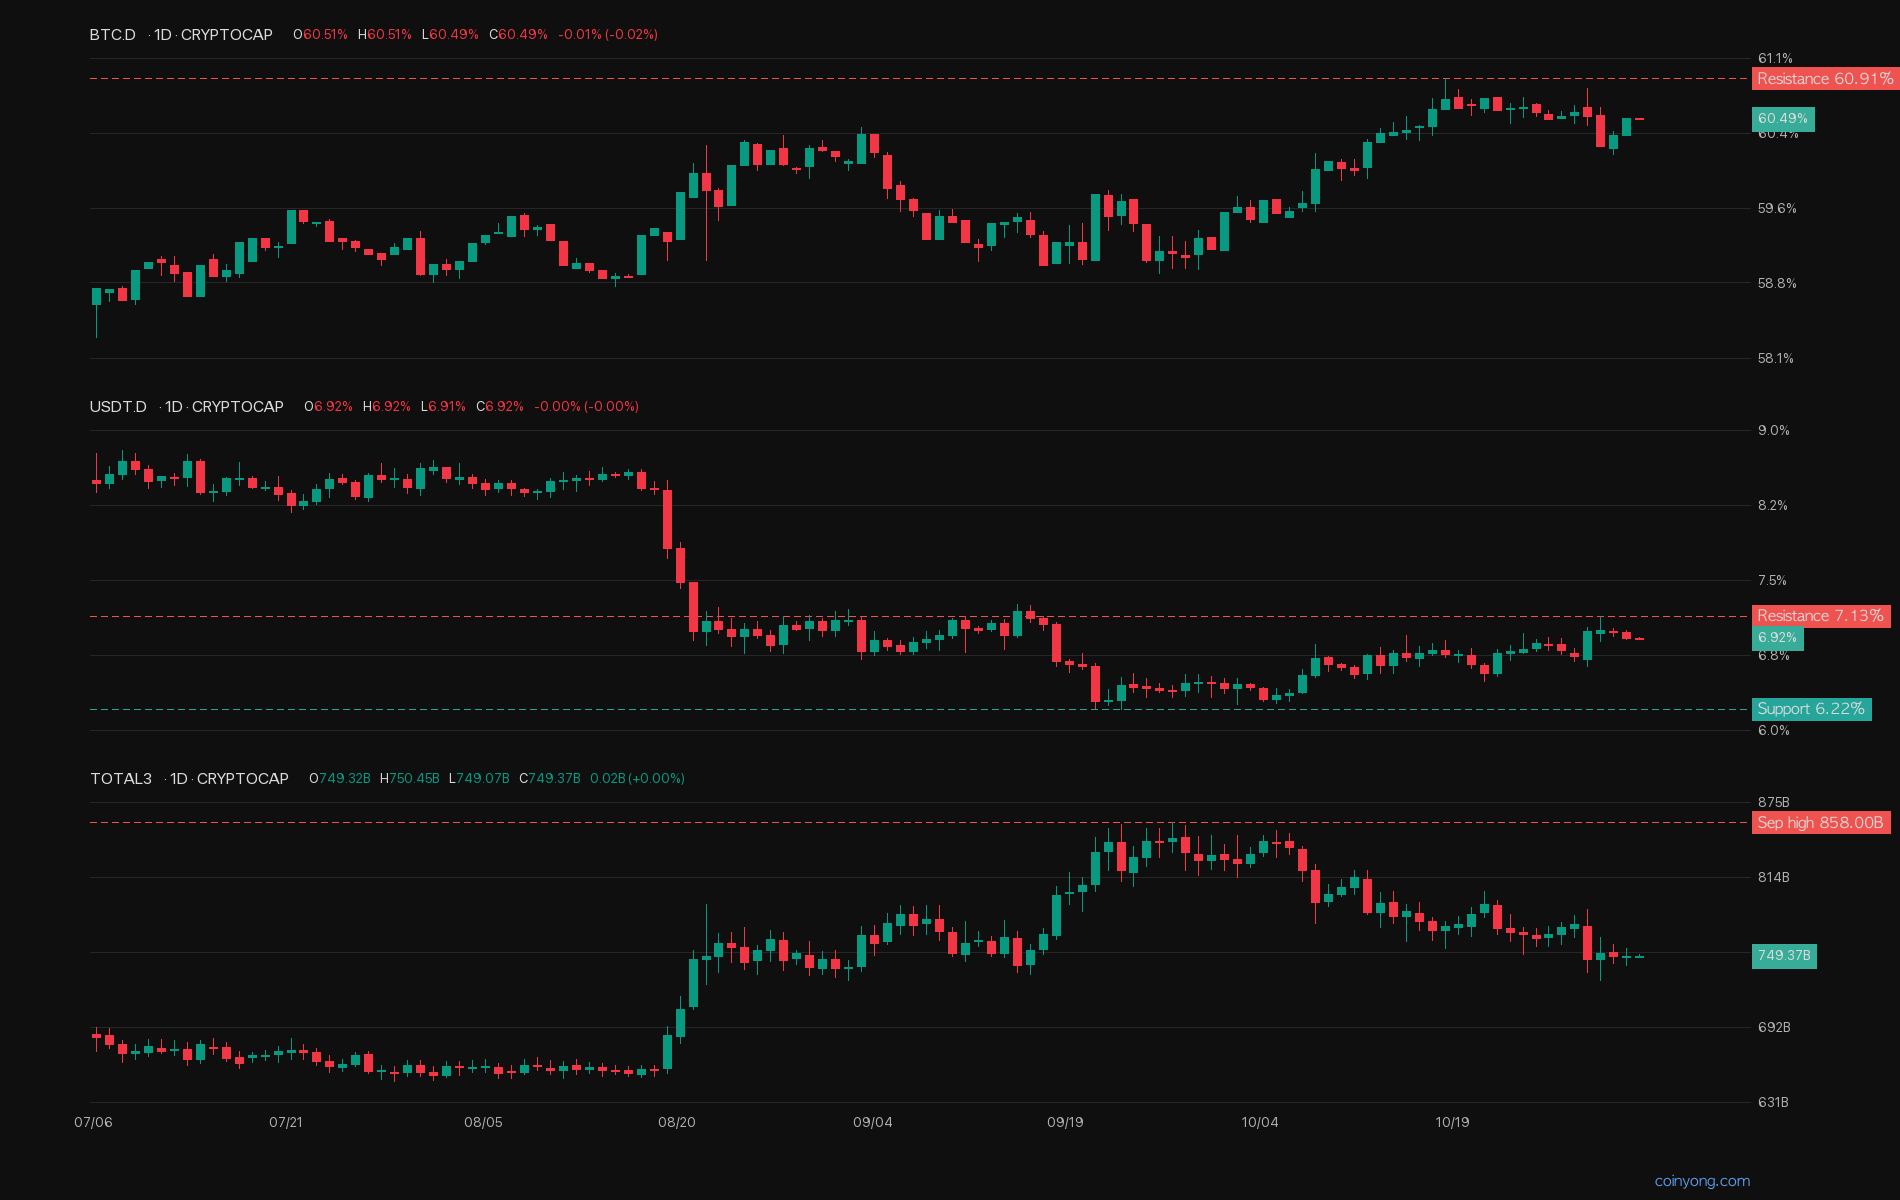
This is a chart of Bitcoin dominance, Tether dominance and altcoin market cap excluding BTC and ETH (TOTAL3). Bitcoin dominance stalled near 60.5% all week, below its October 18 high of 60.9%, while Tether dominance rose from 6.86% to 6.92% and spiked to 7.13% the day after the incident. It has been rising for six weeks since the September low of 6.22%, and altcoin market cap shrank another 1.9% this week, now 13% below its September high.
Money isn't moving into Bitcoin or alts — it's leaving for cash. Ethereum (ETH) also closed its weekly candle at 2.28K, below 2.3K, for four red weeks in a row.
The bounce looks weak too. The support line that had held the lows since October 8 has broken, and that former support now sits around 79K; volume on the climb from 76.3K was less than half the prior average. Top traders' long-position ratio remains elevated at 62.6%, and potential long-liquidation levels are clustered around 77.3K and 76.5K, so another drop could accelerate.
In the end, the shock from the incident has eased with withdrawals resuming, but money is still parked in cash, and the pattern of lower weekly highs and lows remains intact. Personally, I'm leaning toward 76.3K giving way this week and a slide to the 50-week MA and the 74.5–75K support zone. On the other hand, a daily close above 79.3K would invalidate this view and put 84K, where the one-year downtrend line sits, back in play.
Key resistance 79.3K (broken support line; a daily close above invalidates)
Volume zone 77.3K (most trading over the past 80 days)
First support 76.3K (October 30 low)
Next support 74.5K - 75.8K (last April's and this September's lows, 50-week MA)
Ahead of Friday's US jobs report, the first thing to watch is whether the bounce can get above 79K.
 BTC
 TRX
 LINK