Gold Rose, but Bitcoin Fell With the Nasdaq — Will 75K Give Way Too?
 Coinyong
 MARKET
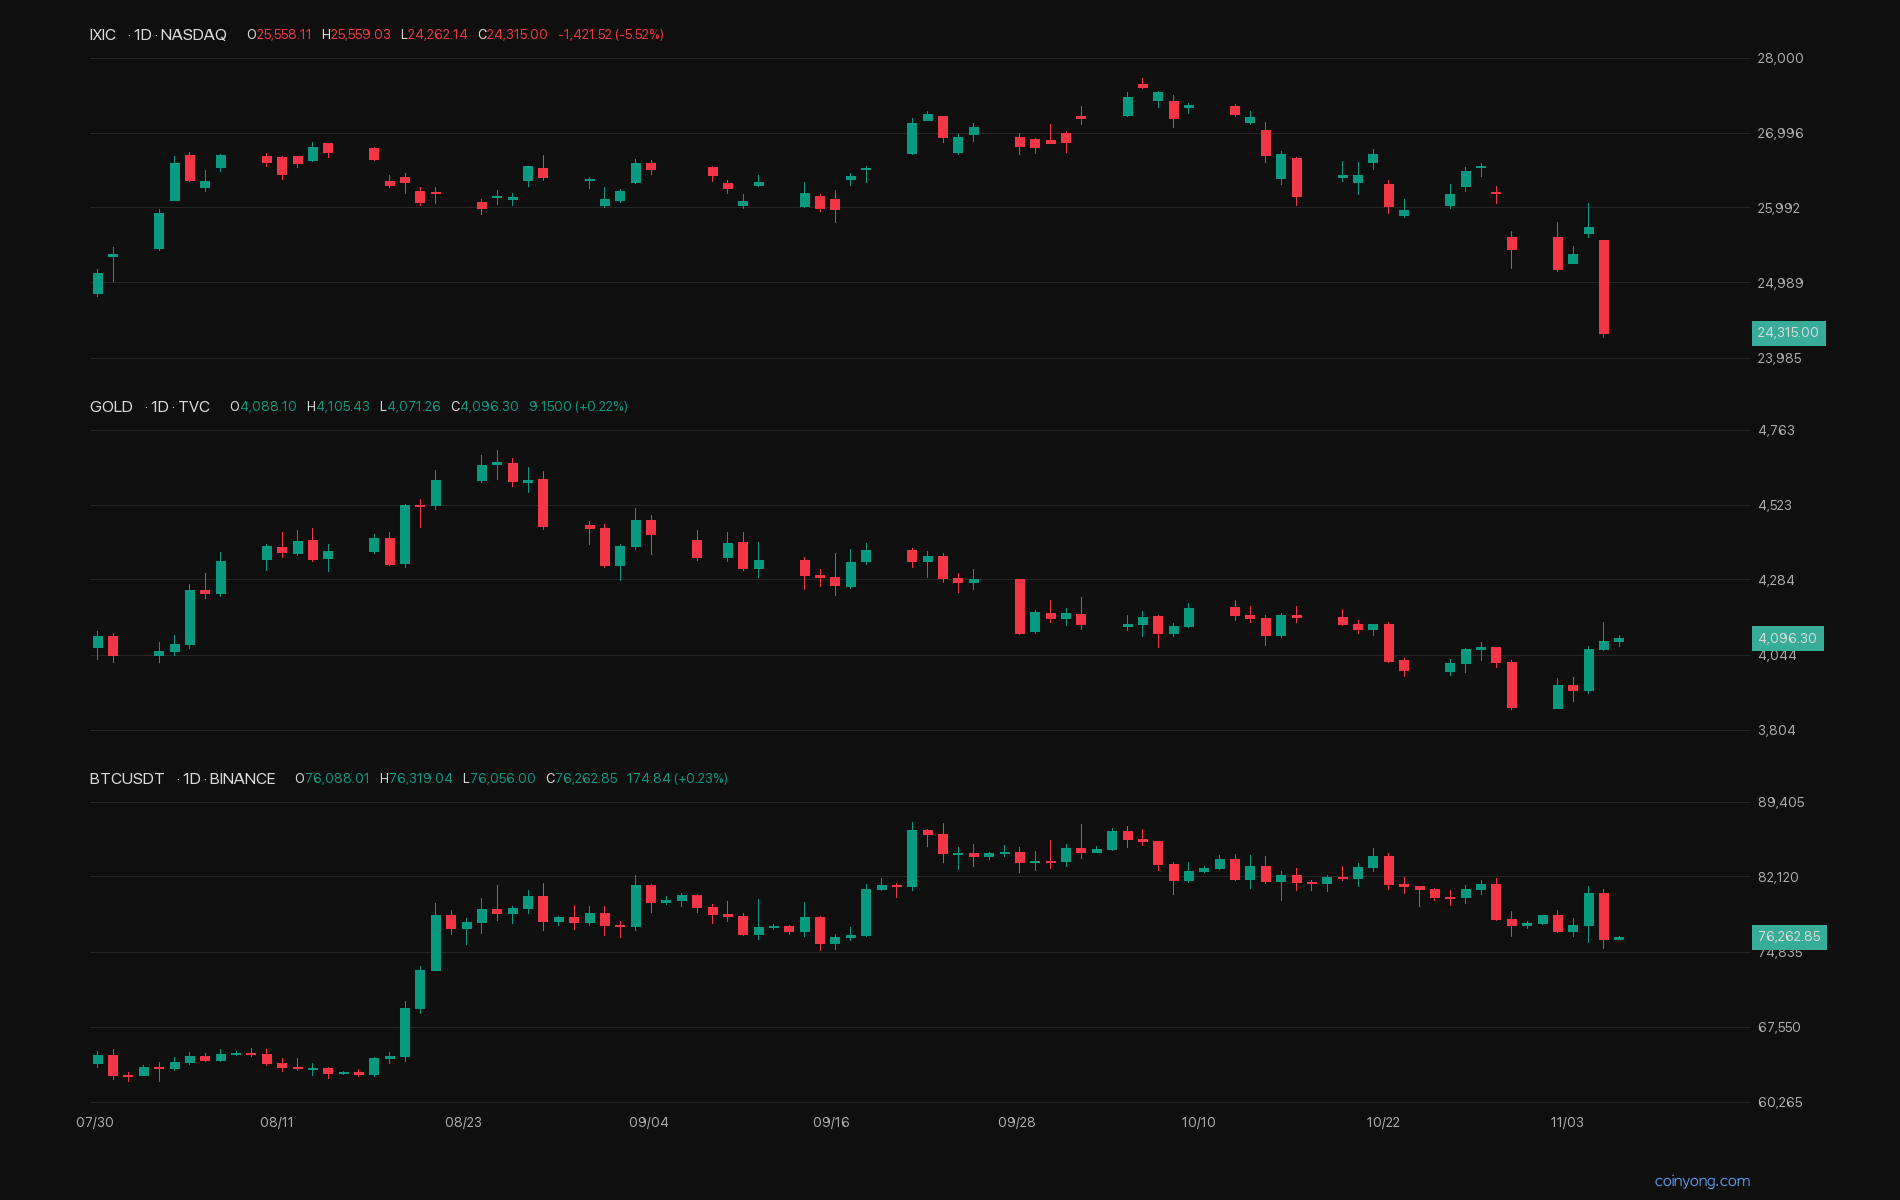
The Nasdaq fell 5.5% in a single day last night. On the same day, Bitcoin's (BTC) daily candle slid by a similar margin, from 80.5K to 76.1K. Gold, on the other hand, went up. So why did Bitcoin follow the Nasdaq instead of gold?
The chart above lines up the Nasdaq, gold and Bitcoin daily candles on the same dates. The Nasdaq and Bitcoin have both been making lower highs since their early-October peaks. Gold is bouncing from its late-October low.
Even though US Treasury yields fell, risk assets sold off all at once. On the safe-haven side, gold edged higher.
What matters here is that Bitcoin isn't yet a safe haven like gold. It's trading like a risk asset alongside tech stocks. In this drop, long liquidations were more than 20 times short liquidations. Binance open interest also fell 5% in two days. As stocks wobbled, leveraged longs were the first to be flushed out.
In the last market update, I leaned toward a slide to 74.5–75.8K, with a daily close above 79.3K as the invalidation level. Wednesday's daily candle closed at 80.5K, briefly invalidating that view, but yesterday gave back the entire gain in a single day. Yesterday's daily candle is a bearish engulfing that fully covered Wednesday's green candle, on nearly twice the usual volume.
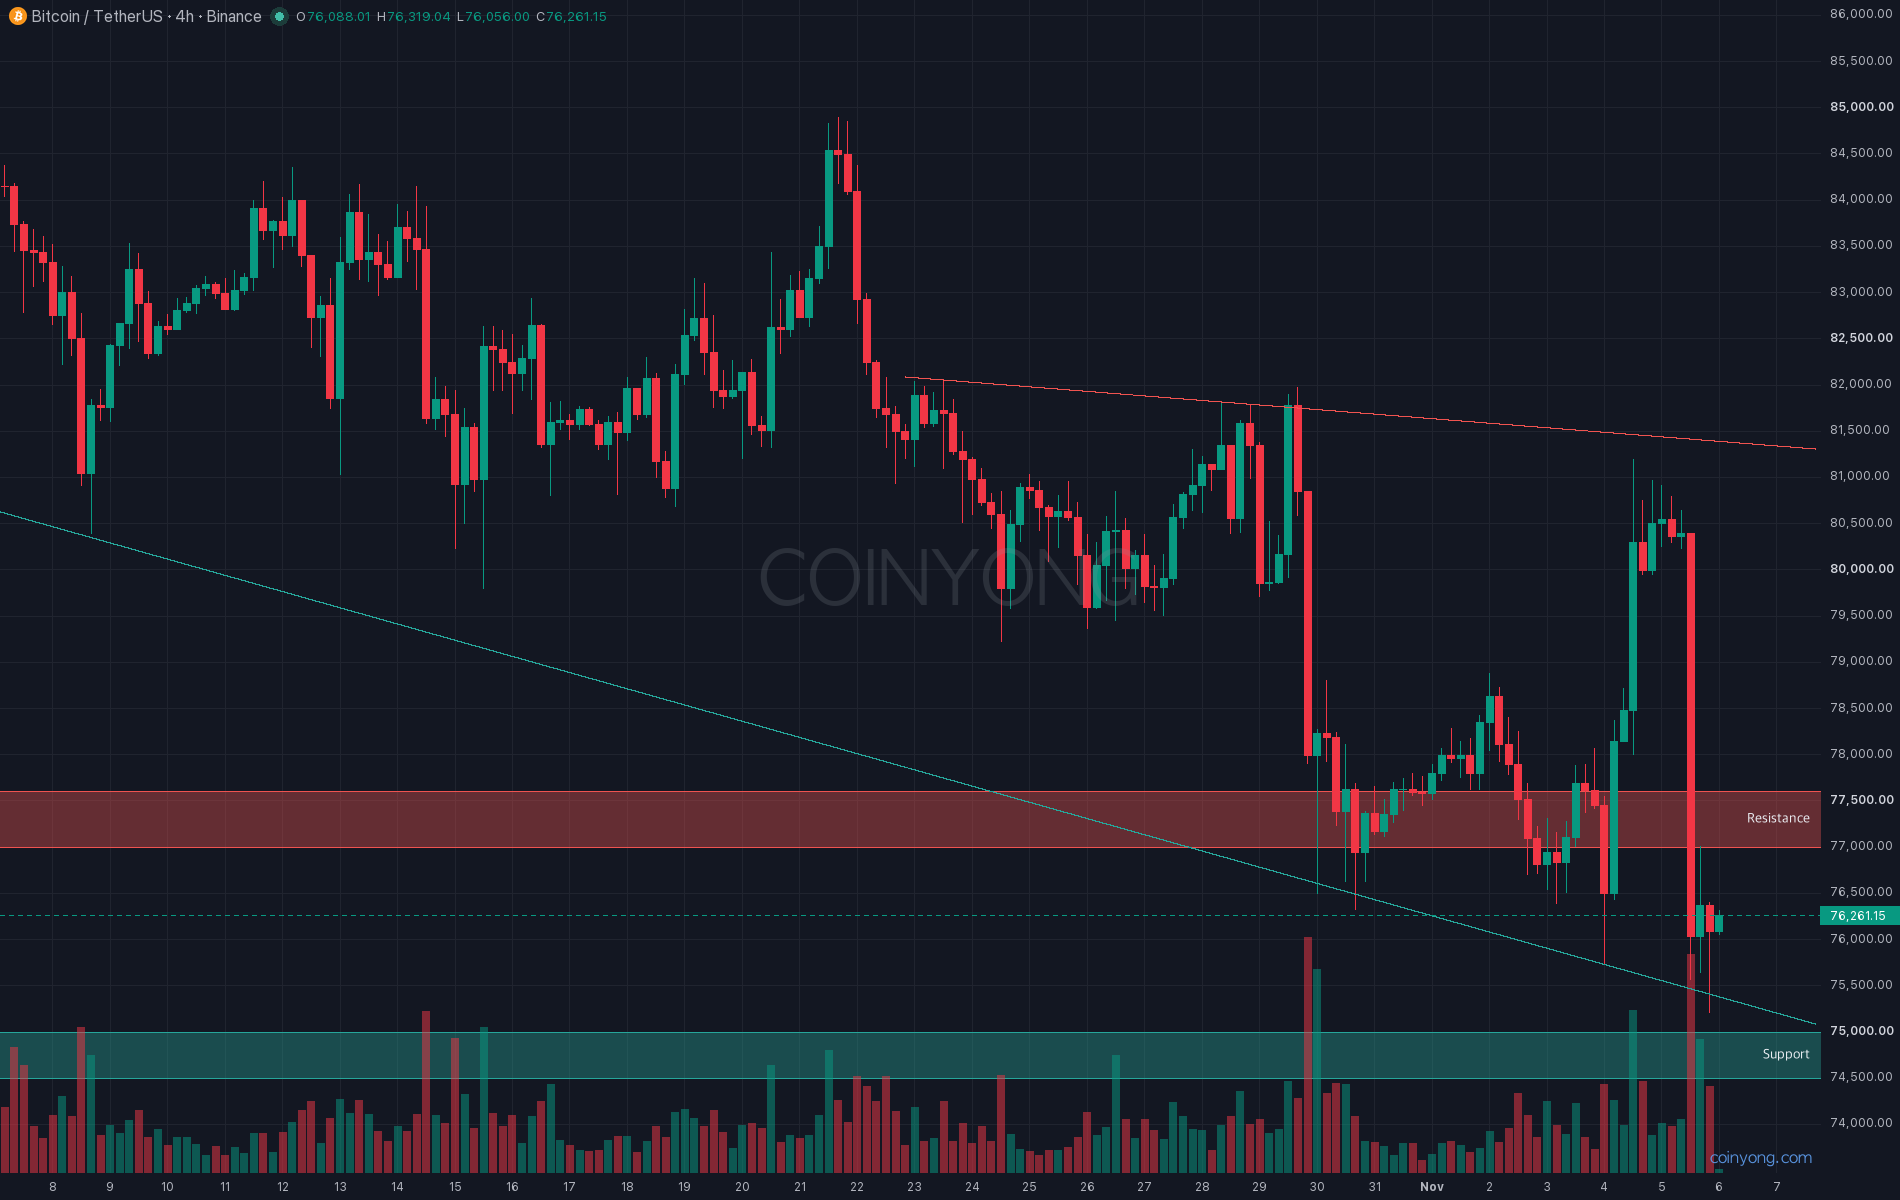
This is the Bitcoin 4-hour chart. The support line connecting the lows since late September now passes through 75.4K. The low of 75.2K in the early hours touched the line before price bounced. Overhead, the downtrend line that has capped highs since late October sits at 81.4K, and Wednesday's bounce was also stopped just below it.
Below the support line, 74.5–75K is where last April's and this September's weekly lows overlap. The bottom of the two-year volume profile also runs through here. The largest concentration of potential long liquidations is also around 75K. If the support line gives way, cascading liquidations could quickly push price into this zone.
Overhead, 77–77.6K, where the broken 4-hour rising line and the 100-day MA converge, is the first resistance. With the 4-hour Stochastic RSI bottomed out, a short bounce to this area is possible. But until price closes above it, I treat it as resistance.
In the end, Bitcoin reacted as a risk asset to the Nasdaq plunge. I think it's more likely to test below the support line first than to bounce. Personally, I'm leaning toward 75.2K giving way after tonight's jobs report and a move down into the 74.5–75K zone. On the other hand, a daily close above 77.6K would invalidate this view, and the 81.2K high would come back into play.
Key resistance 77K - 77.6K (broken rising line, 100-day MA; a daily close above invalidates)
4-hour support line 75.2K - 75.4K
Next support 74.5K - 75K (weekly lows, bottom of the two-year volume profile)
Now is the time to watch whether Bitcoin lifts along with the Nasdaq when it bounces.
 UNI
 XRP
 ETH