Uniswap Breaks Its Month-Long Downtrend Line — Now Only 7.8 Stands in the Way
 Coinyong
 UNI
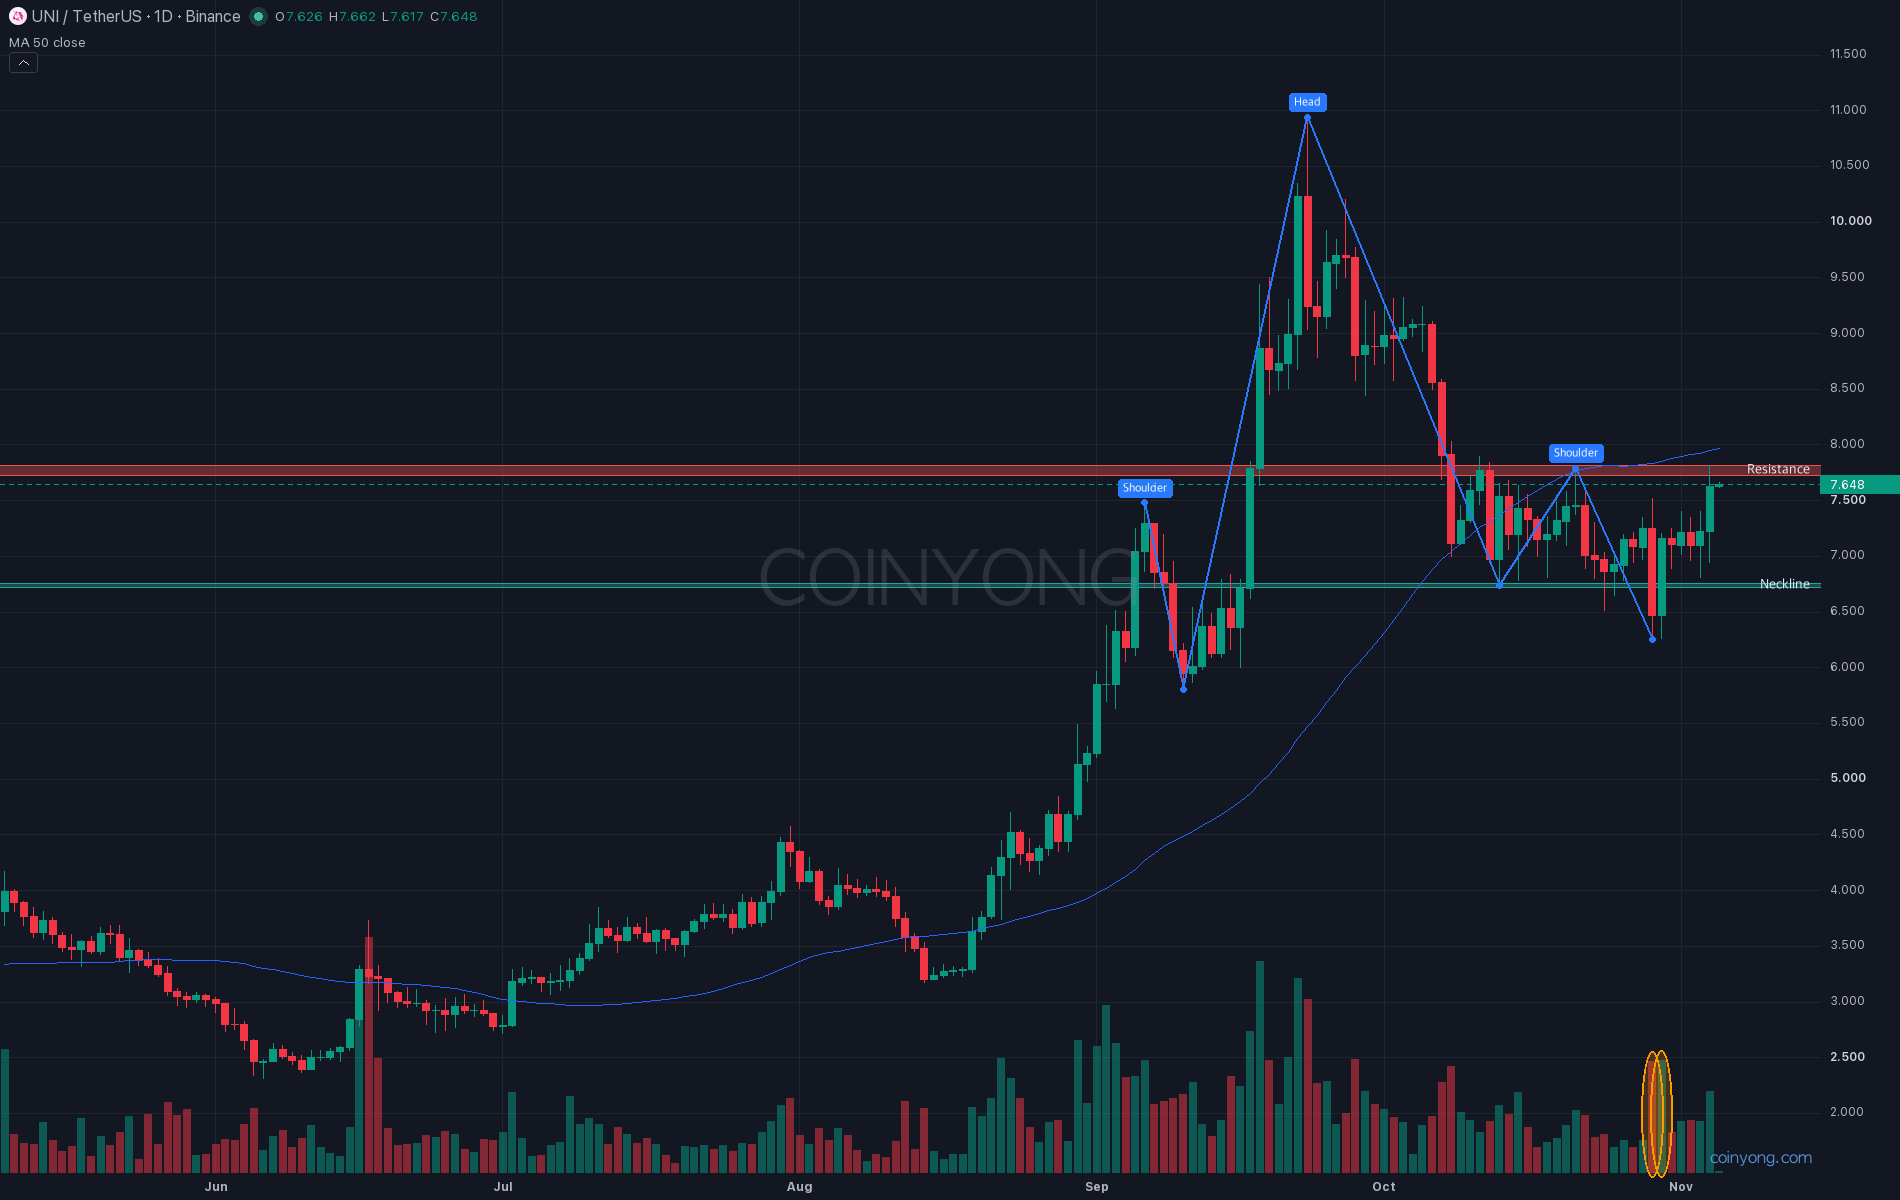
Uniswap (UNI) gained more than 5% on yesterday's daily candle, closing in the 7.6 area. On the day Bitcoin reclaimed 80K, UNI saw particularly strong trading activity among altcoins — so has the decline that's run since the September high finally ended here?
This is the UNI daily chart. In September it more than tripled in a month to reach 10.9, then retraced a little under half of that rally. And in late October, it nearly suffered a sharp breakdown. A head-and-shoulders formed with the September high as the head, and the October 29 daily candle closed below the 6.74 neckline.
But the very next day, a long green candle reclaimed the 7.1 area. Both the breakdown day and the reclaim day came on more than twice the usual volume. What matters here is that the market rejected the path lower in just one day.
On the weekly chart, it continues to close above the 200-week MA, and the big downtrend line from the 2024 high was already broken over the summer.
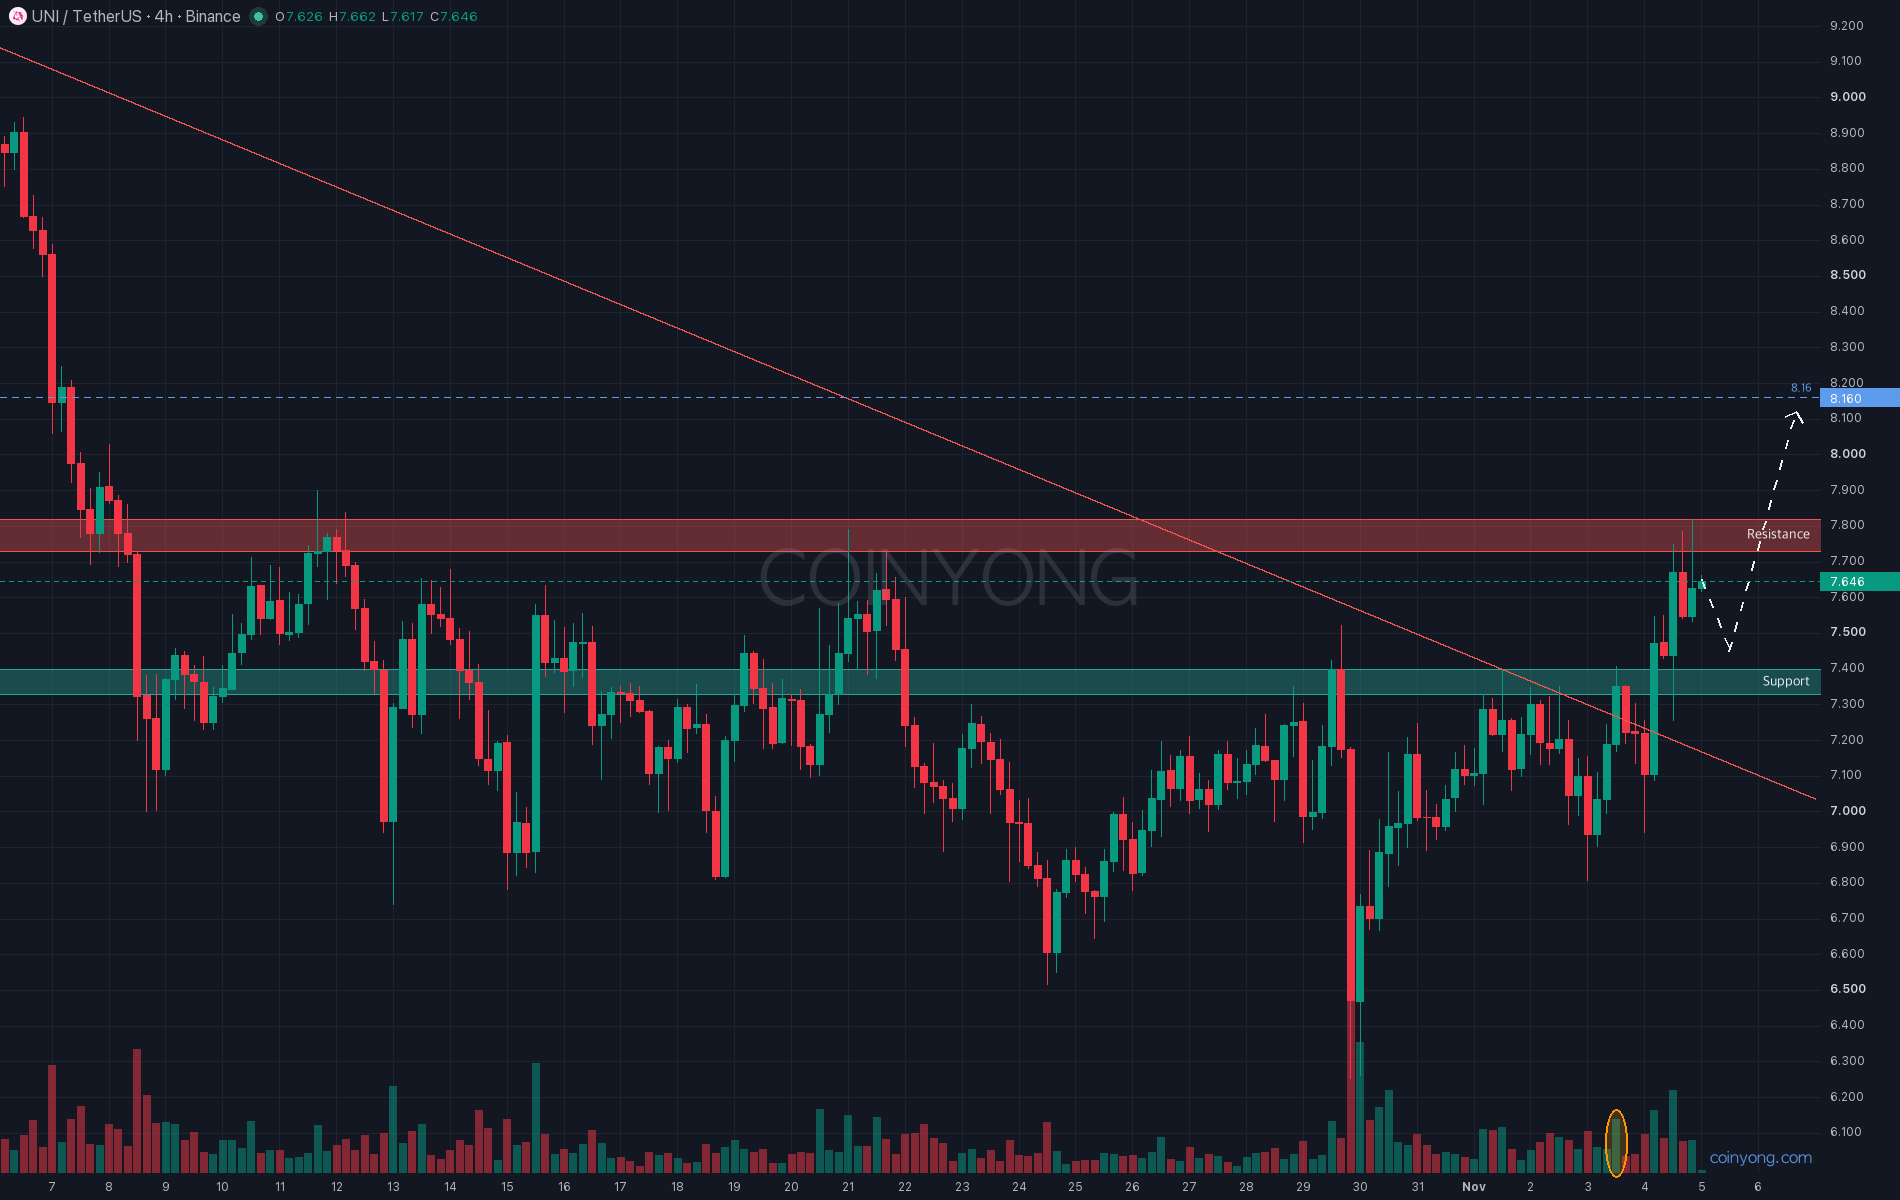
This is the UNI 4-hour chart. Price broke above the downtrend line connecting the early-October high and last week's highs the night before last. It also cleared the 7.35–7.40 highs that had capped every bounce for a week yesterday, and is now holding above them. The candle that broke the downtrend line also came on above-average volume.
The problem is right overhead. 7.73–7.82, where the October 21 high sits, has capped price several times on the weekly chart too, and last night price poked up to 7.82 and left an upper wick. The Fibonacci 0.5 retracement overlaps at the same level.
Order flow isn't bad either. Price rose yesterday, but futures open interest actually dipped slightly. That means the bounce wasn't driven by crowded leveraged longs, and the share of buyer-initiated trades over the past week has risen above its one-month average. With Tether dominance easing, money seems to be trickling back into alts.
In the end, what's left is 7.8. Personally, I'm leaning toward a break above this level, through 7.95 where the daily 50 MA sits, and on to 8.16. That said, I'm also keeping open a scenario where price dips to 7.4–7.5 first before heading higher.
On the other hand, a 4-hour close below 7.35 would mean this breakout failed. A daily close back below the 6.74 neckline would invalidate this view, and the October 29 low of 6.25 could come back into view.
Key resistance 7.73 - 7.82 (October 21 high)
Next resistance 7.95 - 8.16 (daily 50 MA, Fibonacci)
First support 7.35 - 7.40 (former resistance, now support)
Now is the time to see whether the daily candle closes above 7.8.
 XRP
 ETH
 MARKET