Why XRP's Bounce Hit Resistance at the 1.29 Downtrend Line Again
 Coinyong
 XRP
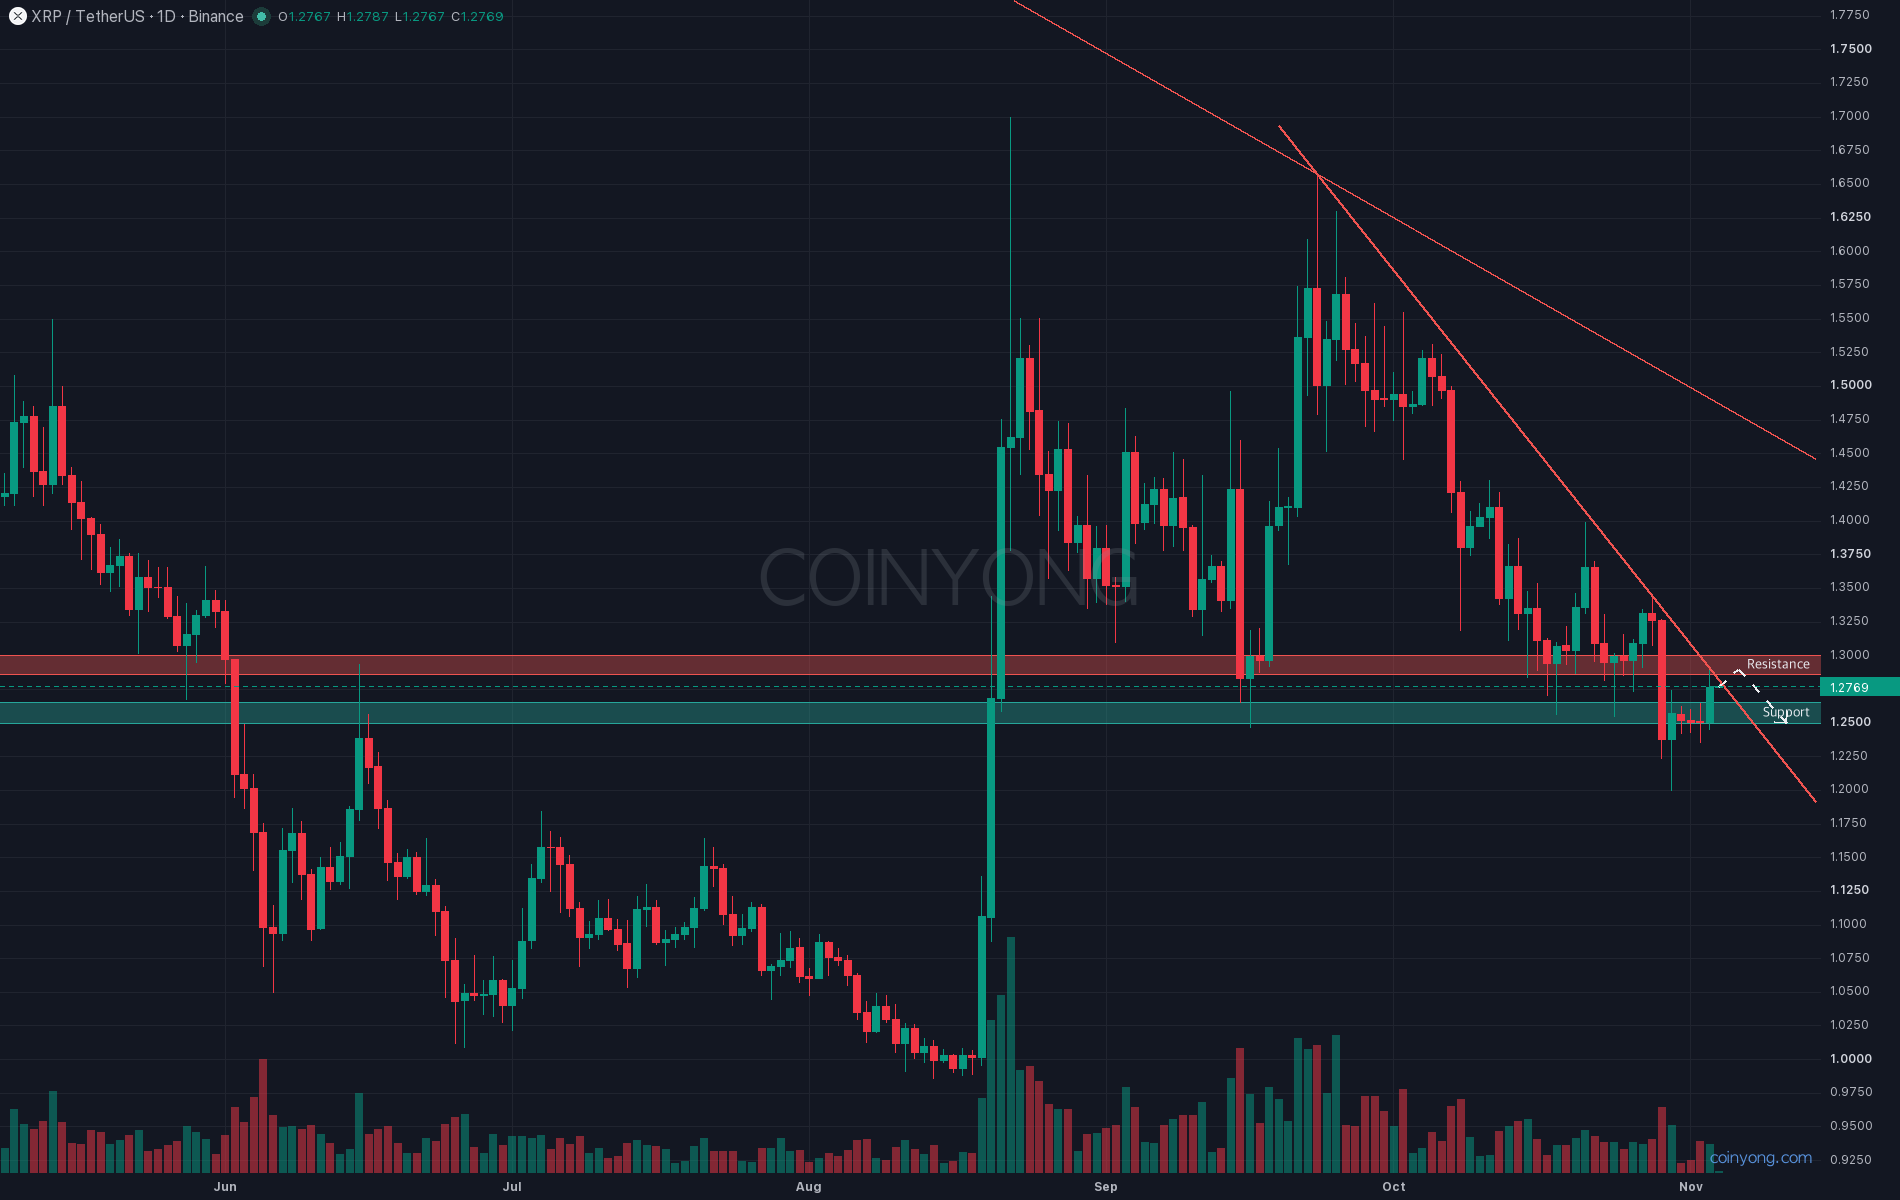
XRP dropped to 1.20 last week, then bounced back to 1.29. Interest was so heavy that its daily trading volume on Upbit topped Bitcoin's — but can we say this bounce has put in a bottom?
This is the XRP daily chart. The downtrend line that started at 1.66 on September 23 and capped the highs at 1.40 on October 21 and 1.34 on the 28th is now passing through 1.28–1.29. Last night's bounce reached 1.29 but couldn't clear the line and slipped back to the 1.27 area. The daily 20 MA (1.30) and the bottom of the Ichimoku cloud also sit at the same level, so overhead resistance is heavy.
In my last post, I leaned toward a slide to 1.12–1.14 if 1.25 gave way. The October 29 daily candle closed at 1.24, losing 1.25, but the next day price stopped at 1.20 and climbed back above 1.25. It didn't collapse, but highs keep stepping down: 1.40, 1.34, 1.29.
What matters here is the futures market. Binance XRP open interest rose 26% in two days while price gained only a little over 2%, and the long-to-short account ratio stands at 2.3. That means longs betting on a breakout of the downtrend line got in early, so if price is rejected at the line, long liquidations stacked at 1.23–1.25 could deepen the drop.
The broader market isn't in alts' favor either. Over the past month, Tether dominance rose from 6.36% to 6.95%, and altcoin market cap excluding BTC and ETH shrank 12%. Bitcoin is also struggling in the 77K area after four straight red weeks.
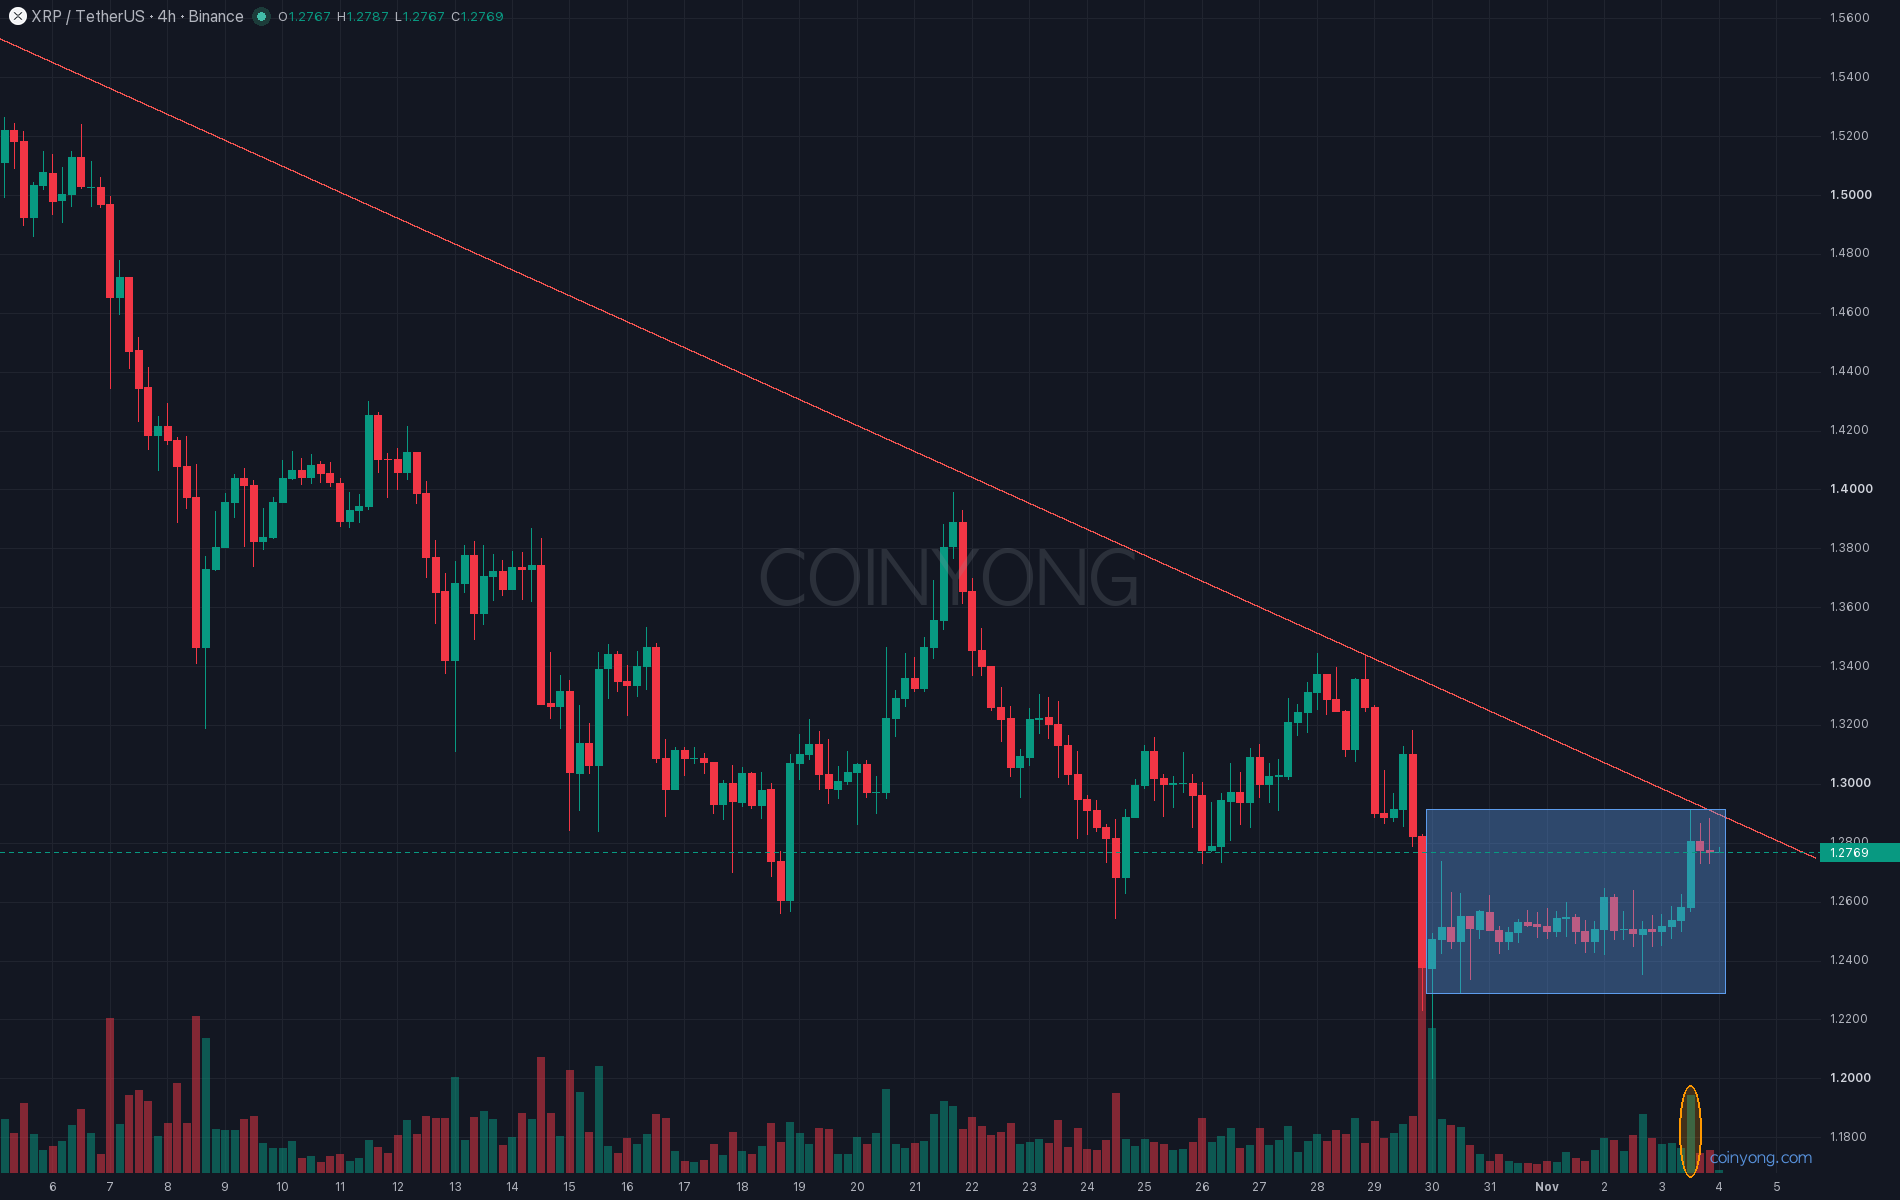
This is the XRP 4-hour chart. Since the 1.20 low on October 30, price has moved inside a 1.23–1.29 box, and the top of the box is exactly the same downtrend line. After being pinned below 1.26 for several days, the 9 p.m. candle last night pushed up to 1.29 for the first time on heavy volume, but left an upper wick and was pushed back right away. OBV barely rose over that stretch.
In the end, this bounce has done little more than reclaim 1.25, and personally I'm leaning toward another rejection at the 1.29 downtrend line and one more test of 1.25 support. A daily close below 1.25 could bring the October 30 low of 1.20 back into view. On the other hand, a daily close above 1.30 would mean a break of the downtrend line and invalidate this view, in which case the 1.34 high comes back into play first. Above that, near 1.49, the long-term downtrend line that has run for more than a year from last September's high remains major resistance.
Key resistance 1.29 - 1.30 (downtrend line, daily 20 MA)
First support 1.25 - 1.265 (October floor, Fibonacci 0.618)
Next support 1.20 (October 30 low)
Ahead of Friday's US jobs report, the first thing to watch is how the daily candle closes against the 1.29 downtrend line.
More analysis
 ETH
 MARKET
 BTC