Stellar Retests Its August Low at 0.15 — and This Time, There's Less Support Below
 Coinyong
 XLM
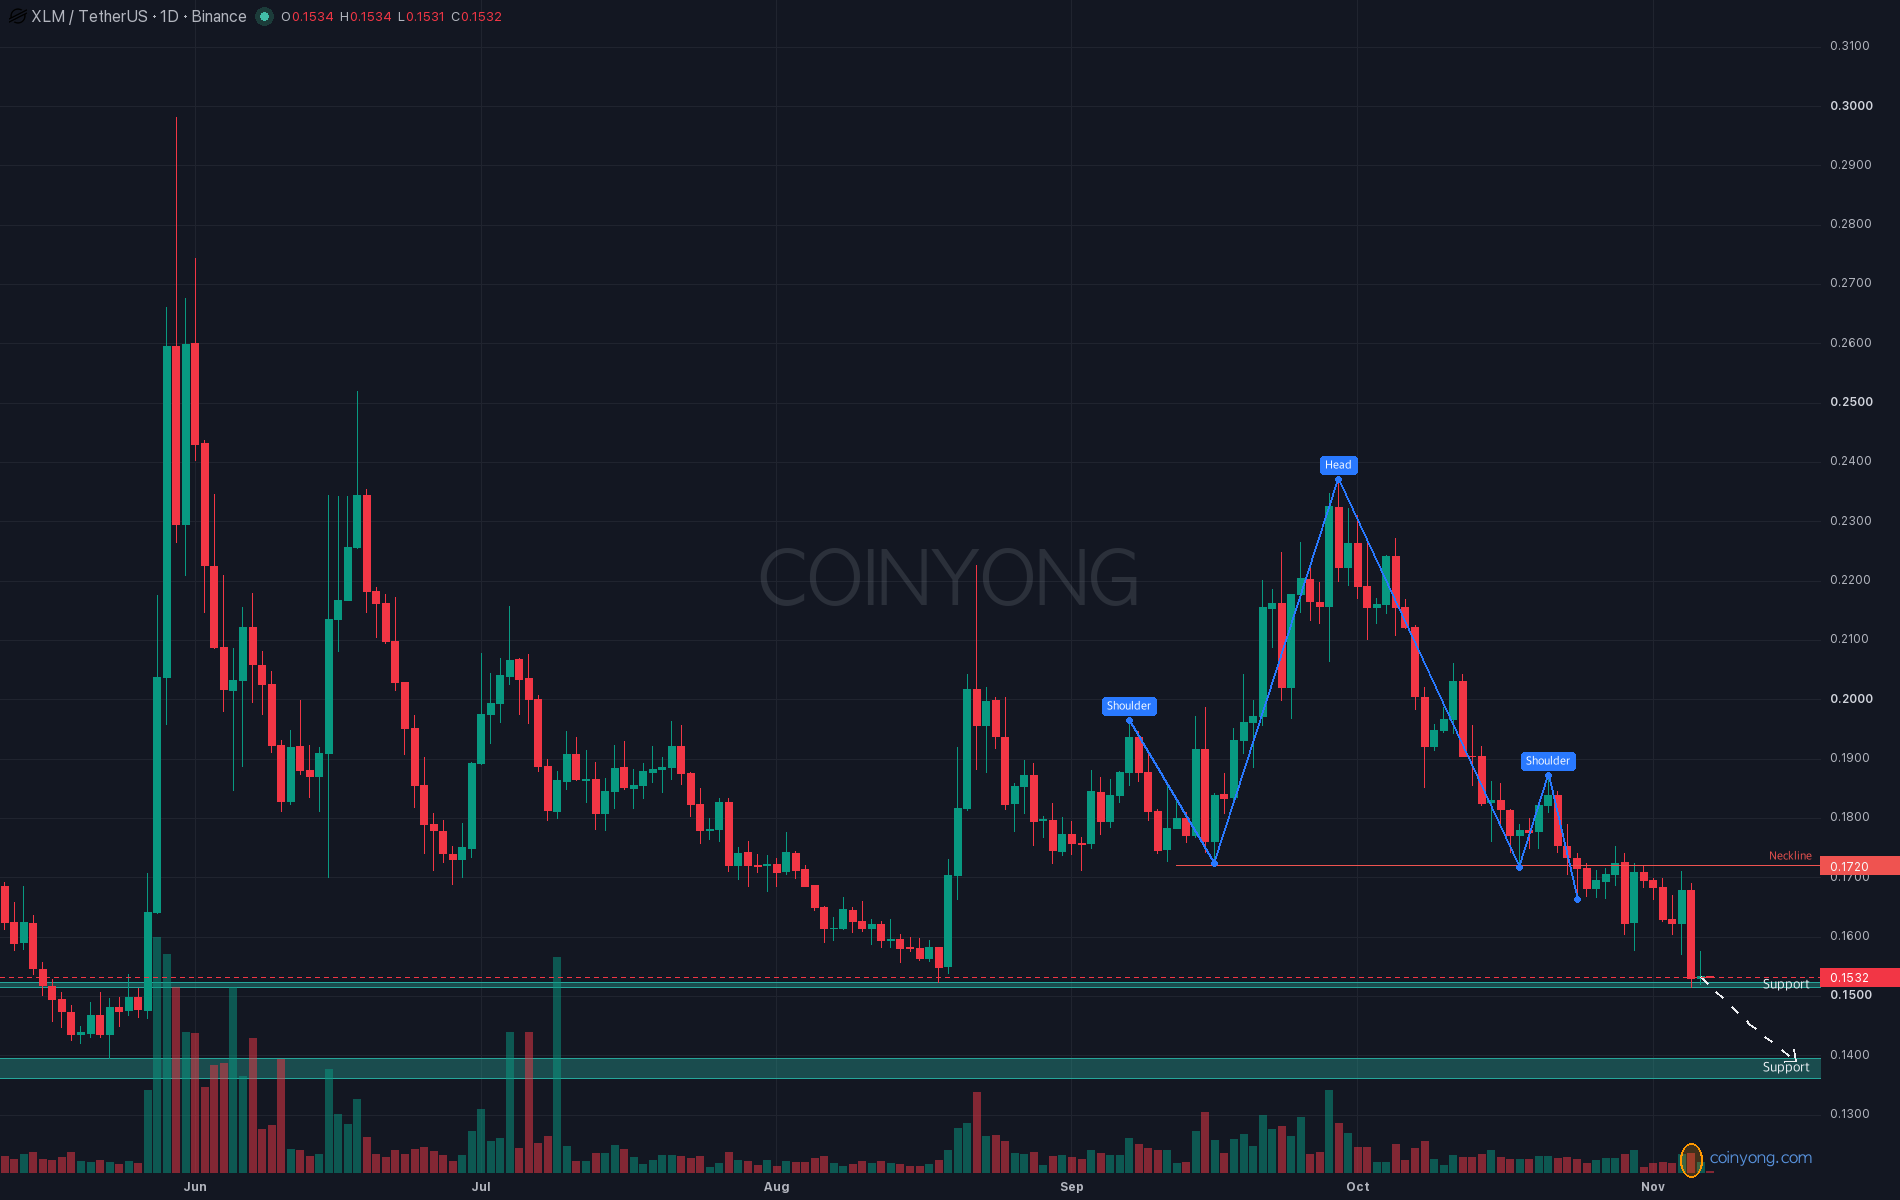
Stellar (XLM) has dropped back to around 0.15, where it bottomed in August. Back then, price bounced right off this level. Can we expect the same this time?
This is the XLM daily chart. A head-and-shoulders pattern has formed, with the late-September high as the head. Since losing the neckline around 0.172 in late October, price hasn't been able to hold above it. Each bounce topped out lower than the last, and in the end a single long red candle pushed it down to 0.1515.
What's different from August is the overall market mood. This week Tether dominance climbed again, and the altcoin market cap (TOTAL3) shrank. Over the past day, while other altcoins bounced, Stellar stayed flat. Over the past month, it has underperformed Bitcoin by nearly 20%.
The futures market is worth watching here. Binance Stellar open interest has risen 11% in coin terms since the morning of November 5. Over the same period, funding rates tilted negative. In other words, short positions are building while price stalls.
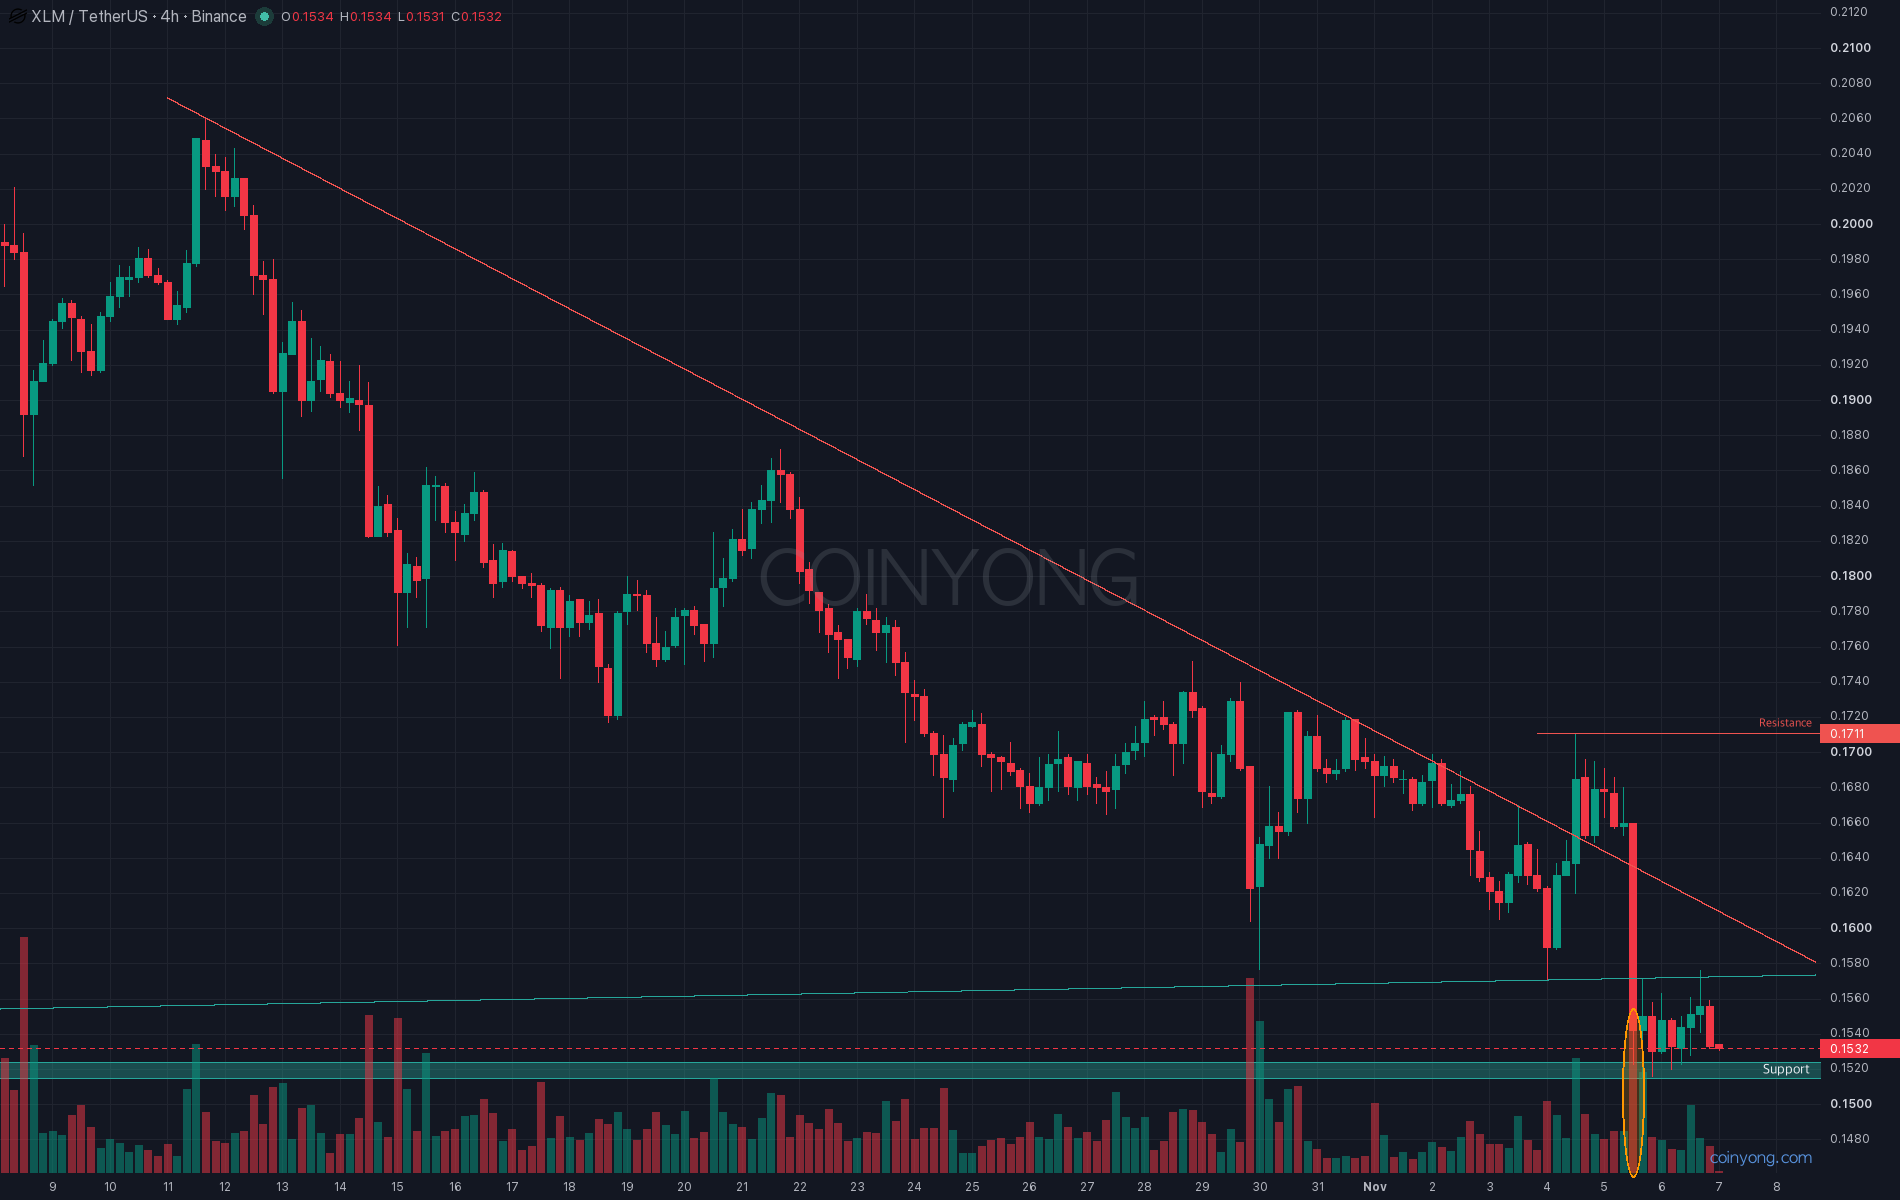
This is the XLM 4-hour chart. On the night of November 4, price broke above the downtrend line that had been capping highs since mid-October, reaching 0.171. But the next night, a single long red candle sent it back below the line. The support line running from the August low broke at the same time. With the breakout failing within a day, buyers trapped above are now likely to sell into rebounds, acting as resistance.
There isn't much below. On the volume profile, there's less than a third as much volume below 0.15 as around the current price level. If 0.15 gives way, there's little to stop a drop toward 0.14, where the February and May lows sit.
Put simply, after losing the neckline, bounces keep stalling at lower highs. Personally, I'm leaning toward a drop toward 0.14 if XLM gets a daily close below 0.15. That said, with so many shorts piled in, a quick rebound to 0.161 from short covering wouldn't be surprising if 0.152 holds. A daily close above 0.171 invalidates this view.
The Stellar Development Foundation has scheduled a mainnet upgrade vote for the 23rd of this month. However, there's been no official announcement tied to this drop so far.
Key resistance 0.161 - 0.171 (4-hour downtrend line, Nov 4 high)
First support 0.1515 - 0.152 (August and November lows)
Next support 0.136 - 0.14 (February and May lows)
Even if a bounce comes, it's likely to stall below the downtrend line, and if 0.15 gives way, a drop toward 0.14 looks more likely.
 MARKET
 UNI
 XRP