XRP Loses Its 1.20 Floor — Where's the Next Support?
 Coinyong
 XRP
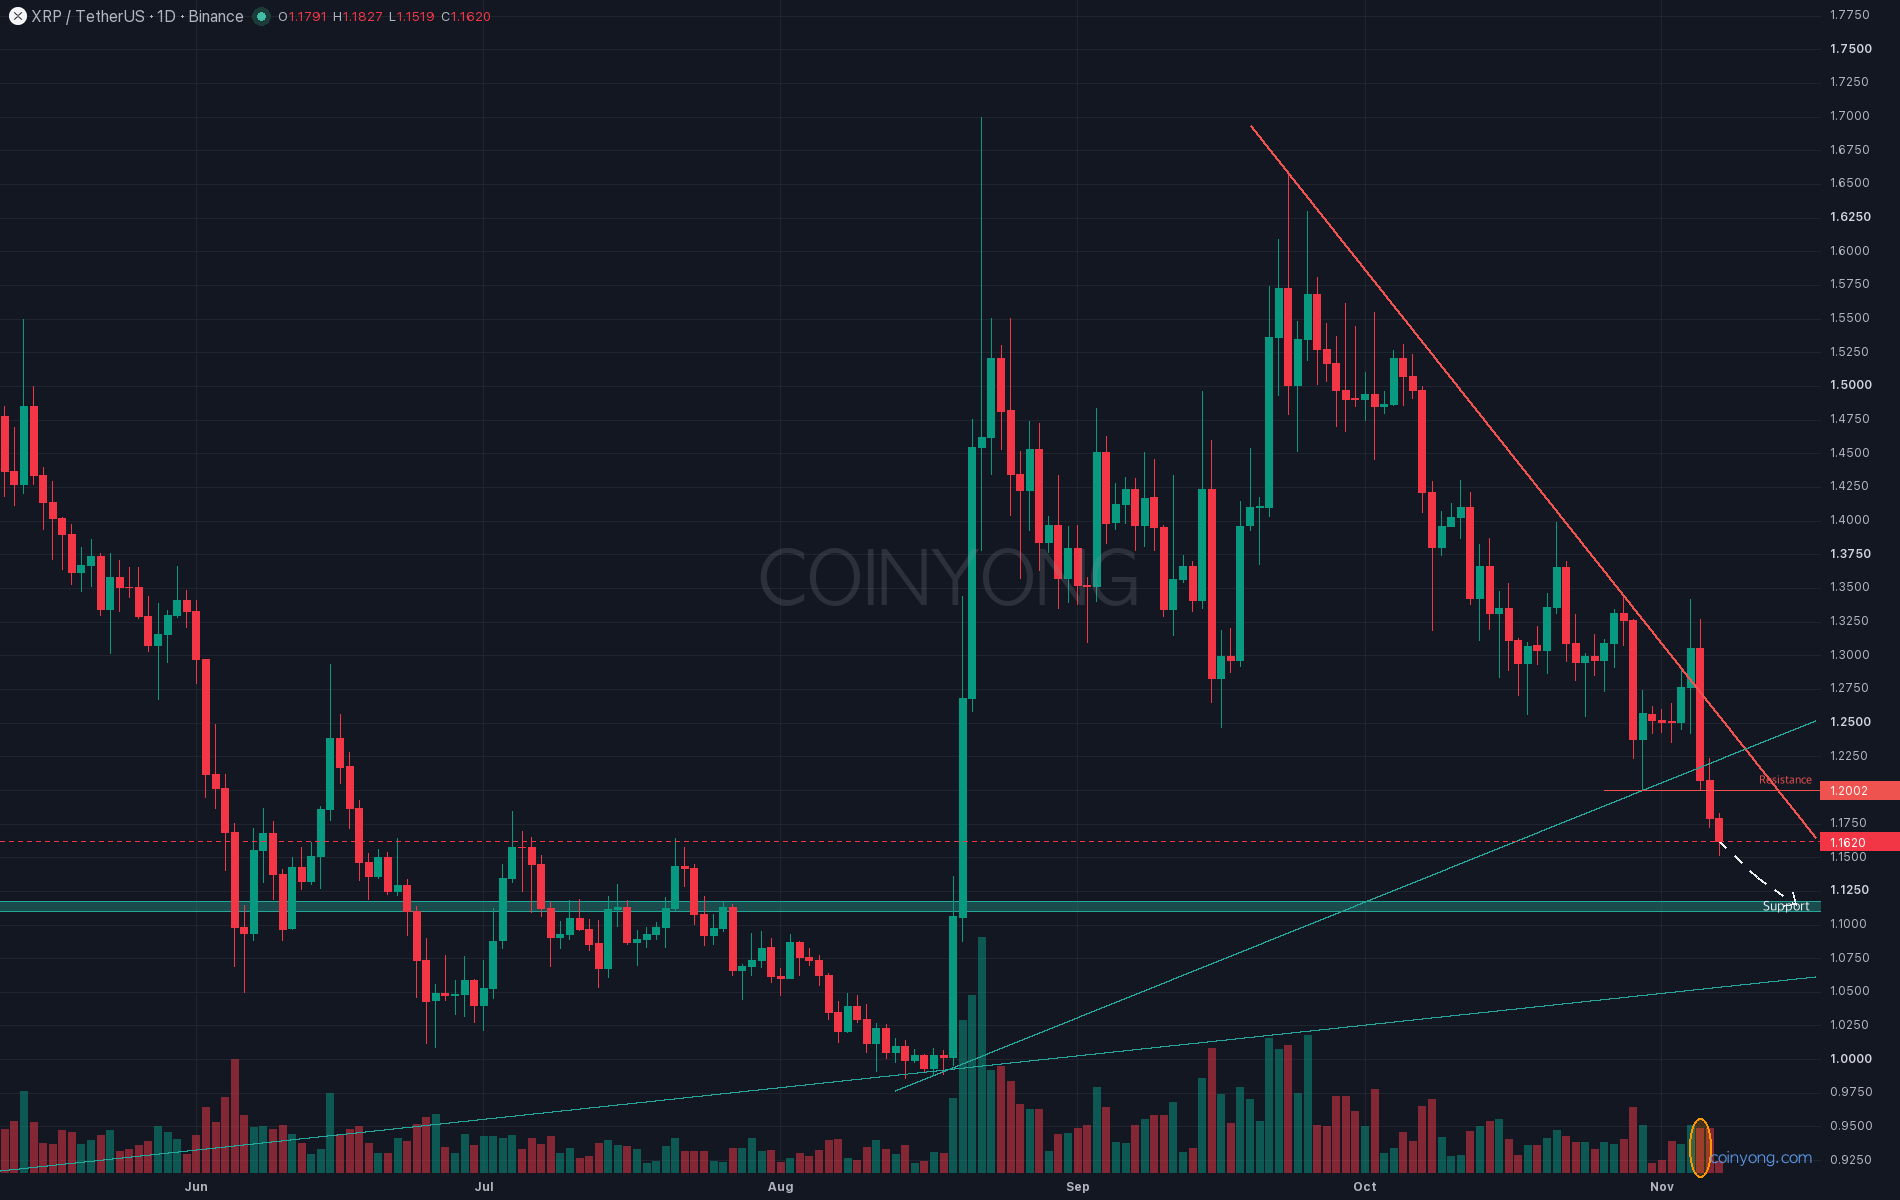
XRP has lost last month's low of 1.20 and slid to 1.15 earlier today. That's its lowest price since the late-August rally. Where will it stop this time?
This is the XRP daily chart. The break above the downtrend line that had been capping price since the September high turned out to be a fakeout. On the way down, the rising support line from the August bottom also broke, and yesterday's daily candle closed below 1.20. It's a classic downtrend structure, with both highs and lows getting lower.
In the last post, I leaned toward a rejection at the 1.29 downtrend line and a retest of 1.25. Instead, XRP rallied to 1.34 on the night of the 4th, and the daily candle closed above 1.30. That bounce, which crossed the invalidation level, was wiped out by a single long red candle the next night, and 1.25 and 1.20 broke one after another.
The futures market is worth watching here. Even as price fell sharply, Binance XRP open interest barely dropped in coin terms, and the long-to-short account ratio is still 3:1. With so many longs still holding on, long liquidations stacked below could amplify the drop.
While Bitcoin has been moving sideways, XRP has been one of the weaker coins among the largest cryptocurrencies by market cap. No announcement has been confirmed as the cause of this drop so far.
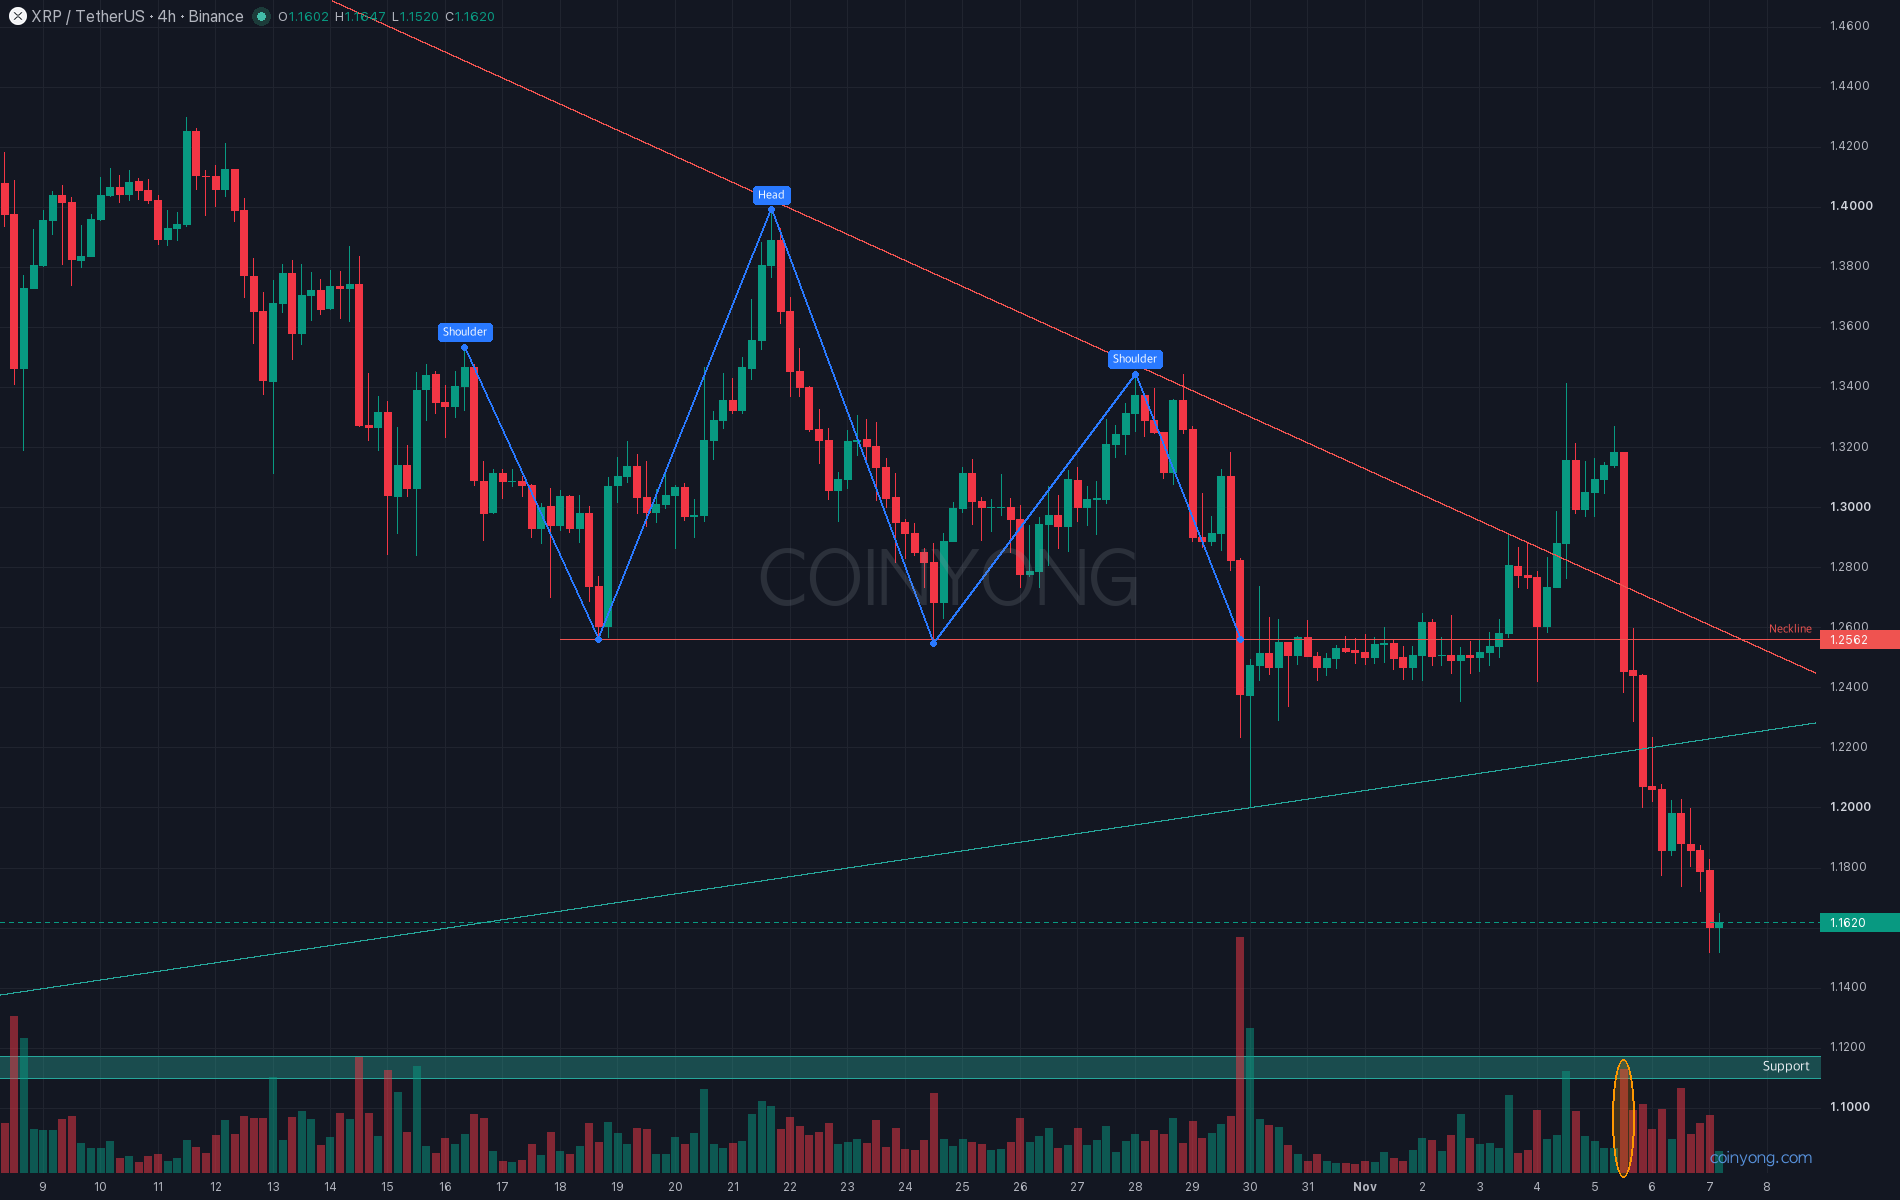
This is the XRP 4-hour chart. A head-and-shoulders pattern is visible, with the left shoulder, head and right shoulder forming since mid-October. After losing the 1.256 neckline, this week's bounce climbed back above it but failed to clear the right shoulder and was pushed down again. Measuring the distance from the head to the neckline down from the neckline puts the target around 1.11.
That zone is the February weekly low, and it also sits in the middle of the volume profile built up over the summer. The volume profile was thin between 1.20 and 1.16, so price fell quickly, but it gets thicker from here, which could slow the decline. The order book also shows the largest bid wall at 1.14.
Put simply, after the fakeout above the downtrend line and the loss of the 1.20 floor, the downside has opened up. Personally, I'm leaning toward a drop to 1.11–1.12 if XRP gets a daily close below 1.15. That said, with the 4-hour RSI in oversold territory, a bounce off the 1.14 bid wall wouldn't be surprising. A daily close above 1.20 invalidates this view, and if 1.11–1.12 gives way too, the next level is around 1.05, where the weekly rising support line runs.
Key resistance 1.20 - 1.226 (Oct 30 low, August rising support line)
First support 1.11 - 1.12 (February low, head-and-shoulders target)
Next support 1.05 (weekly rising support line)
With weekend trading thin, the first thing to watch is whether 1.15 holds on a daily close.
 XLM
 MARKET
 UNI