Dogecoin analysis
Market Analysis
Chart analysis built on data — key levels, volume and the price that invalidates the view
 EthereumETH
 BitcoinBTC
 ChainlinkLINK
 XRP
XRP UniswapUNI
 PolkadotDOT
 Internet ComputerICP
 SolanaSOL
 ArbitrumARB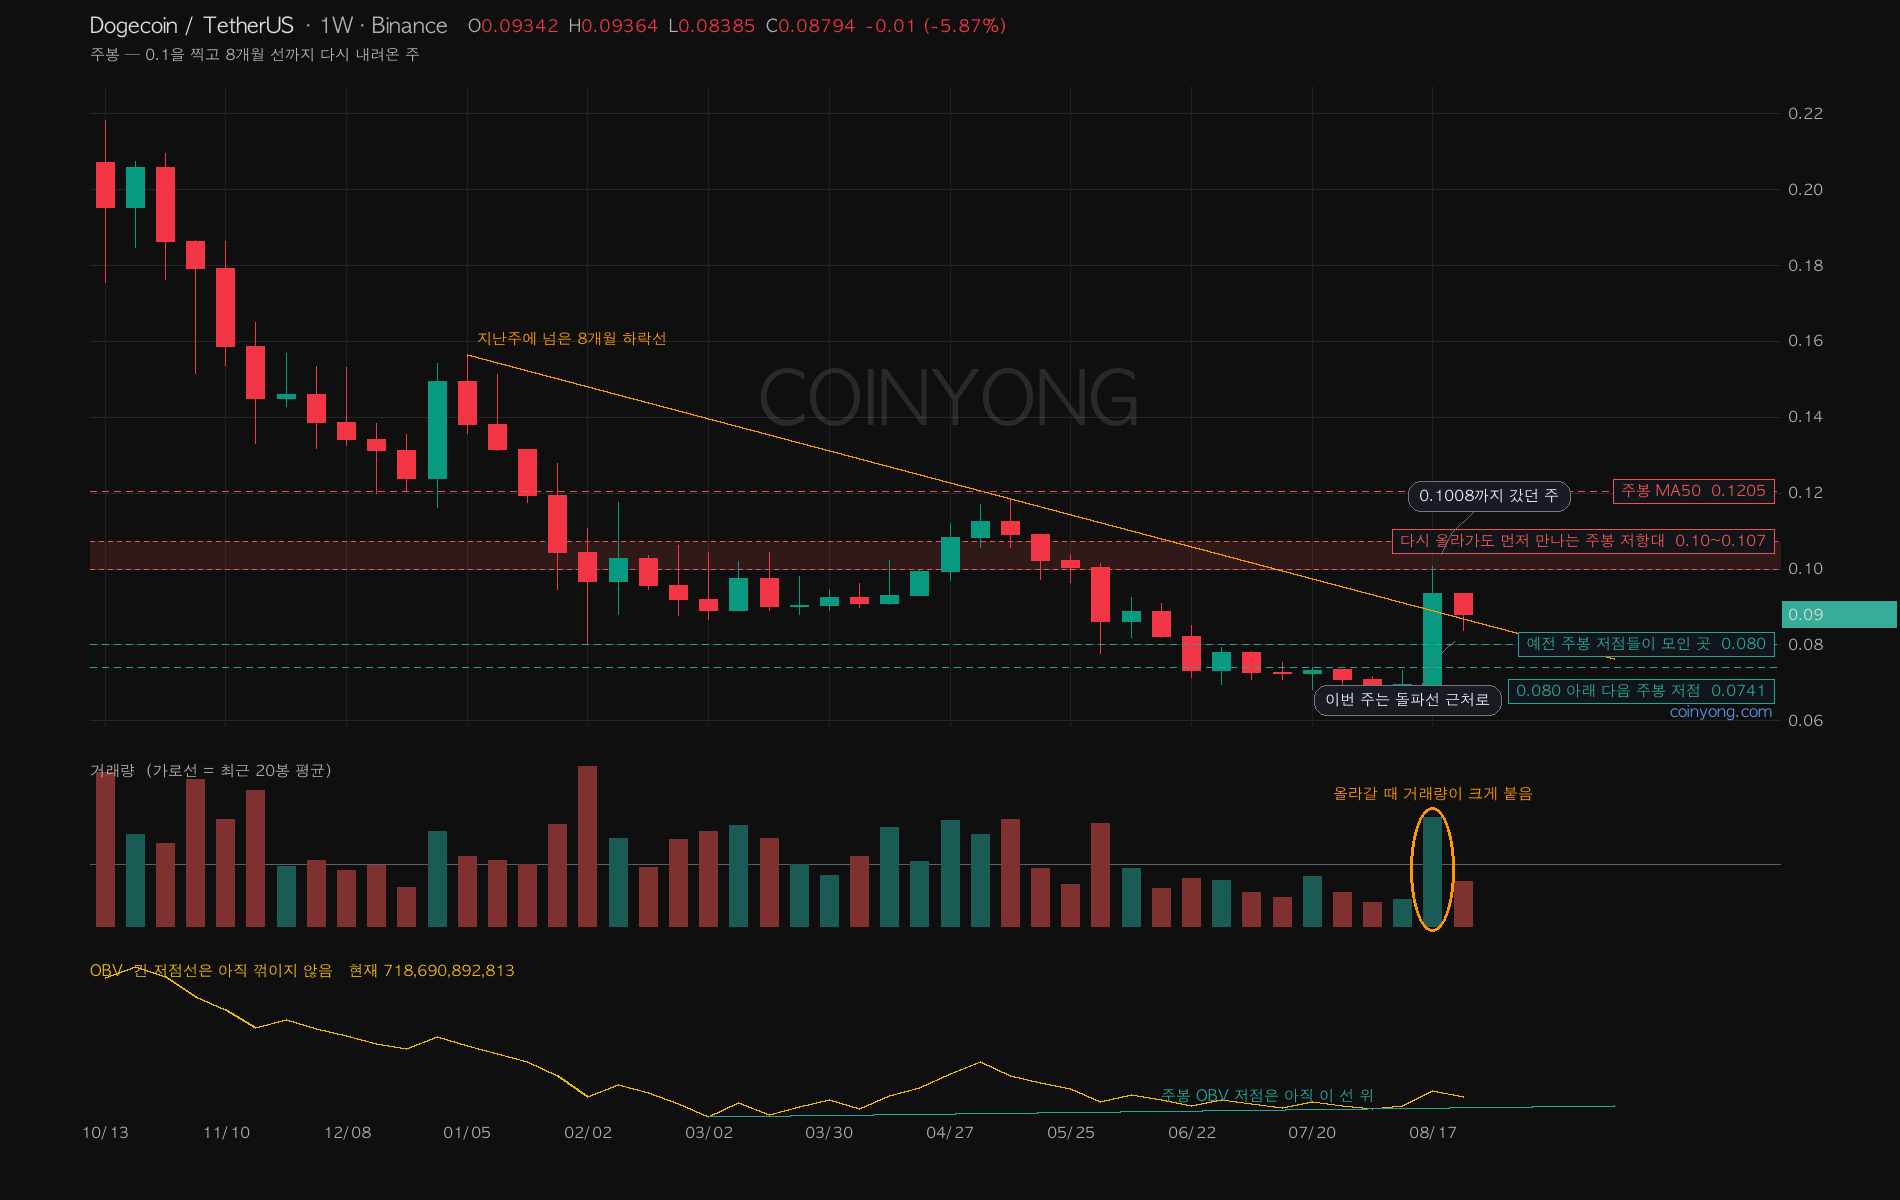
 DOGE
DOGE
DOGE Tagged 0.1, Now Back Where It Started
After running to 0.1008 last week, DOGE has pulled back to the 0.087s. It's back above the 8-month downtrend and the weekly MA20, but still below the daily MA200 at 0.0891, so it's too early to call the breakout a success.
 DOGE
DOGE
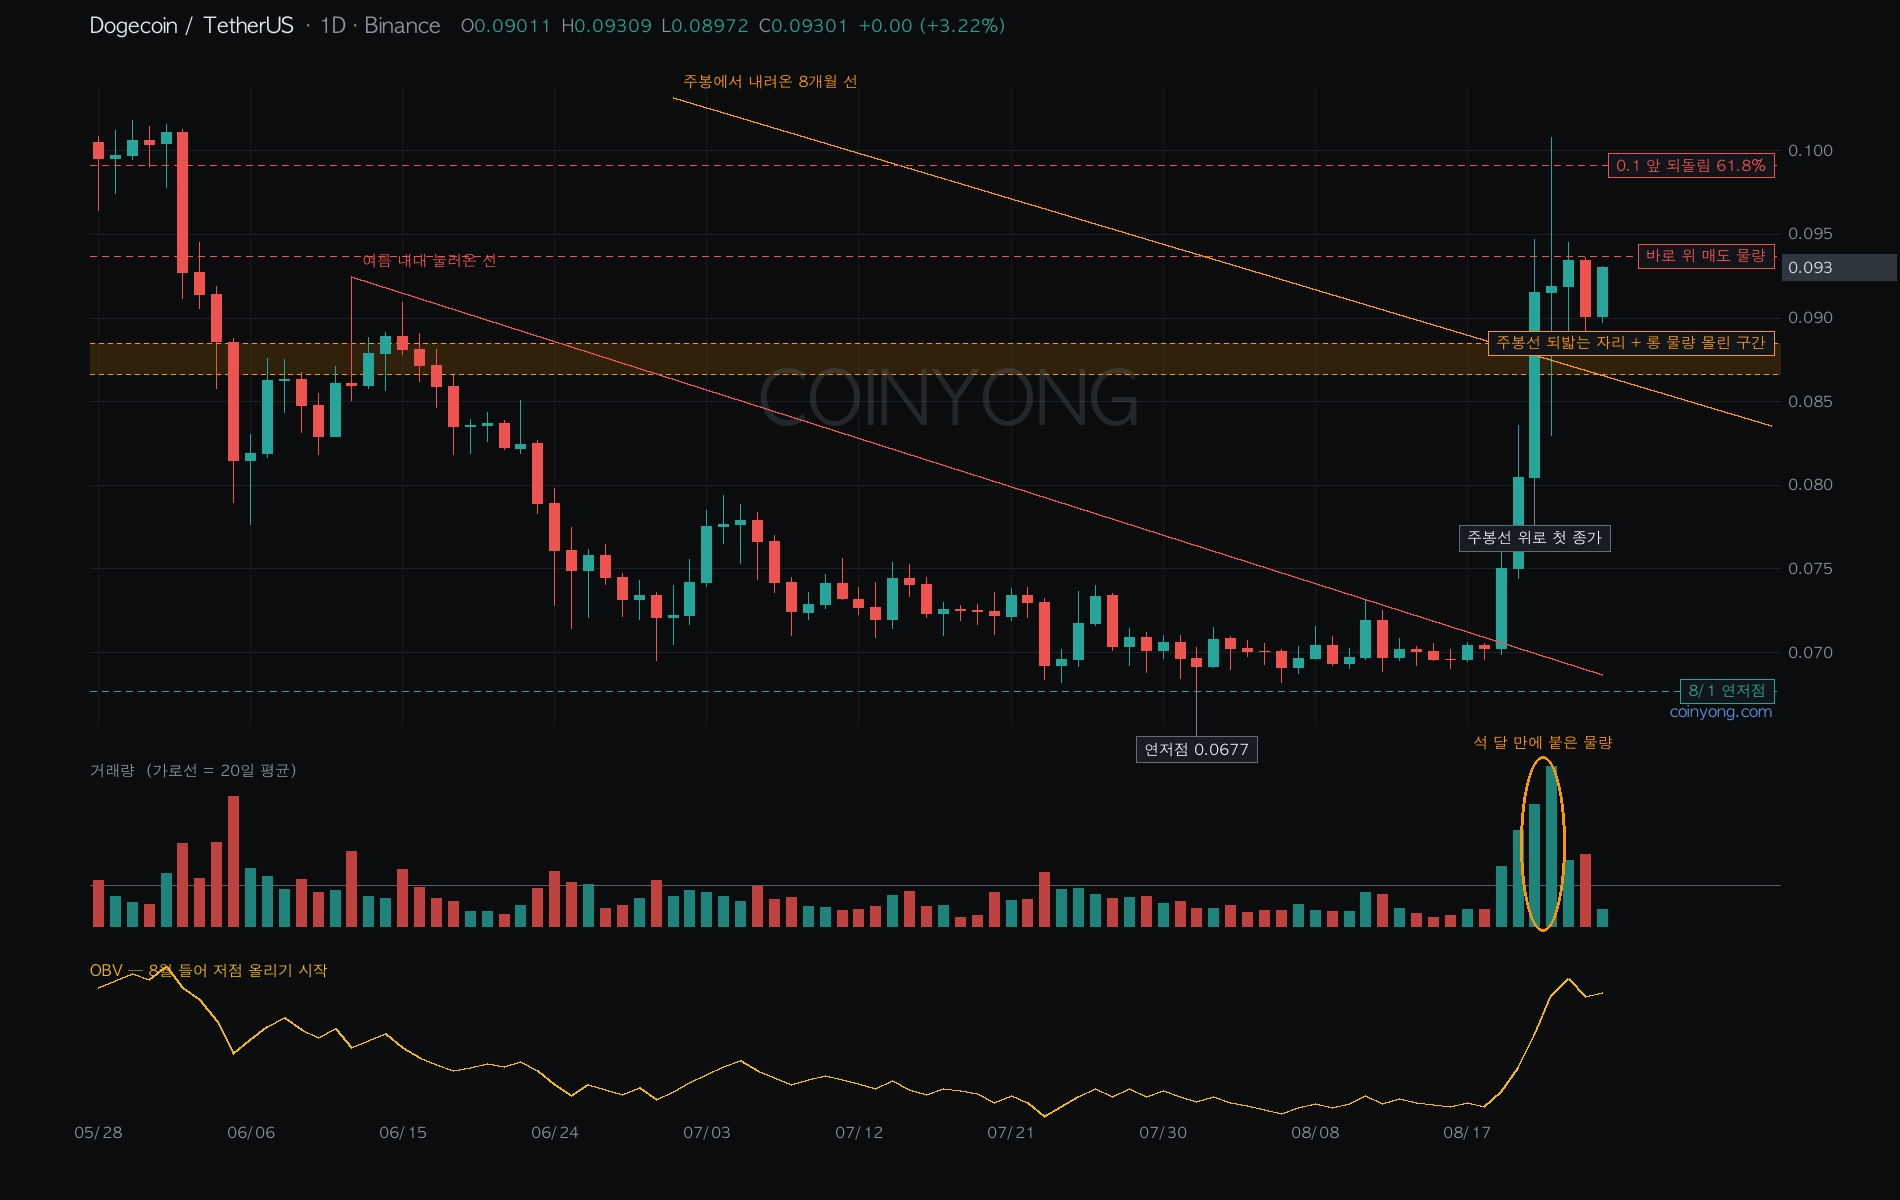
I Wrote DOGE Off — Then Its Chart Flipped Last Week
Eight days ago I said DOGE had to reclaim 0.079 before we could even talk. It's now at 0.0925, and it has cleared the weekly line that capped it for eight months — this calls for a different read.
 DOGE
DOGE
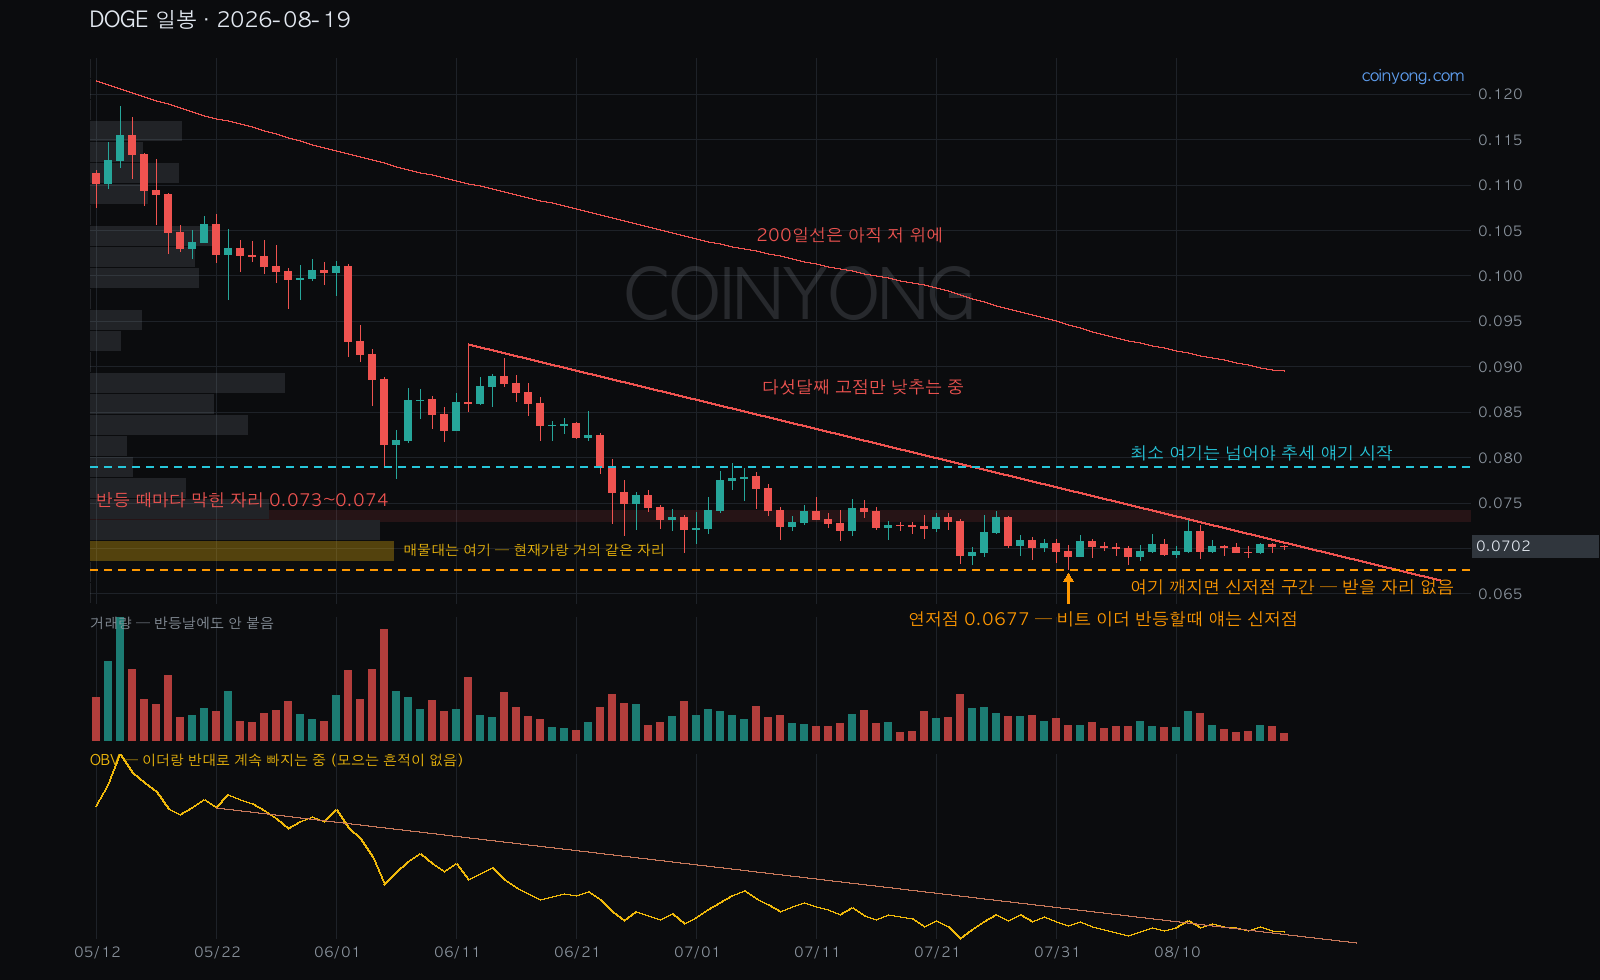
Hands Off DOGE: Yearly Low 3 Weeks Ago as BTC, ETH Bottomed
While BTC and ETH were building a base, DOGE alone printed a fresh yearly low in August. Highs have been falling for five months and OBV keeps sliding, so staying on the sidelines is the position for now.
분석과 함께 보면 좋은 코인용 기능
분석글에서 언급하는 김프(김치프리미엄)는 메인 페이지에서 코인별로 실시간 확인할 수 있고, 청산이 몰릴 가격대는 청산 히트맵에서, 실제 걸려 있는 매수·매도벽은 오더북 히트맵에서 직접 볼 수 있습니다. 분석글의 레벨이 실제 시장에서 어떻게 작동하는지 실시간 데이터로 따라가 보면 차트 보는 눈이 훨씬 빨리 늘어납니다.
본 분석은 정보 제공 목적이며 투자 권유가 아닙니다. 투자 판단과 책임은 본인에게 있습니다.
Market analysis by Coinyong
Coinyong's market analysis starts from data, not gut feeling. We build volume profiles from live Binance candles to find where positions have actually accumulated, track OBV for signs of quiet accumulation, and watch Bollinger Band squeezes for volatility about to be released. Every post states the support and resistance levels that matter, along with the price at which the scenario is invalidated.
Market data on this site is for informational purposes only and is not investment advice.
Coinyongの相場分析について
Coinyongの相場分析は感覚ではなくデータから始めます。Binanceのリアルタイムのローソク足から出来高プロファイルを計算して実際にポジションが積み上がった価格帯を確かめ、OBVで横ばいの間の買い集め・売り抜けの痕跡を追い、ボリンジャーバンドの収縮と出来高の変化から値動きが大きくなる前の兆しを探ります。どの記事にも重要なサポート・レジスタンスと、シナリオが崩れる価格をはっきり書いています。
本サイトの情報は参考用であり、投資助言ではありません。